Repricing Global Risk: Yield Dynamics, Safe-Haven Behavior, and the Gold/Oil Stress Signal
A deep dive into risk sentiment, bond yields, currency performance against gold, and multi-timeline FX trend alignment.
Financial markets enter early December with a decisive tilt toward risk-on positioning, supported by higher-beta equity performance and elevated sovereign yields in high-carry markets. The VIX at 15.41 signals contained volatility, consistent with a stable global equity backdrop and reduced hedging demand. However, beneath this surface calm lies a notable macro warning: the Gold/Oil ratio at 69.80, far above long-term norms (10–30), pointing to underlying economic fragility, weak global oil demand, and an investor preference for liquidity and safety through gold.
Bond yields create an uneven landscape: Australia, the UK, and the US lead with the highest 10-year government rates, providing a structural advantage to their currencies in risk-on carry conditions. Conversely, Germany and Japan continue to underdeliver on real yield compensation, reinforcing familiar capital-flow patterns that favor USD, GBP, CAD, and AUD in relative attractiveness.
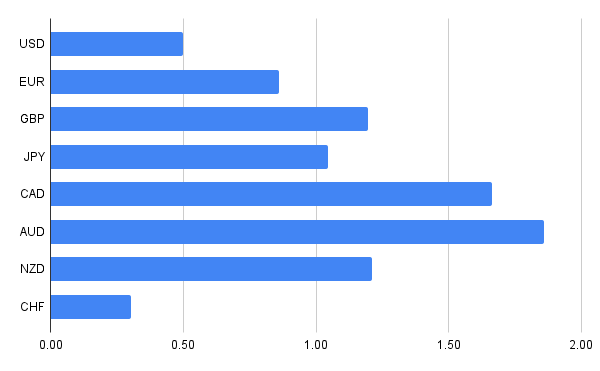
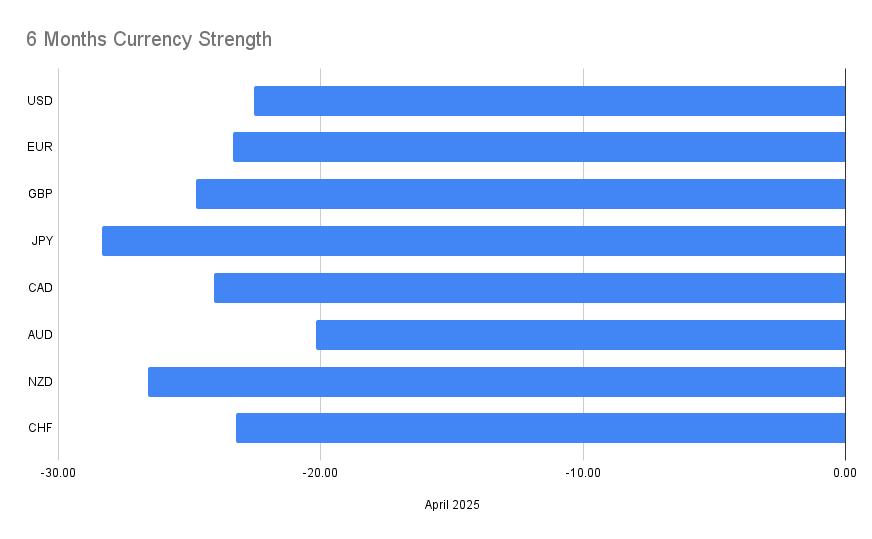
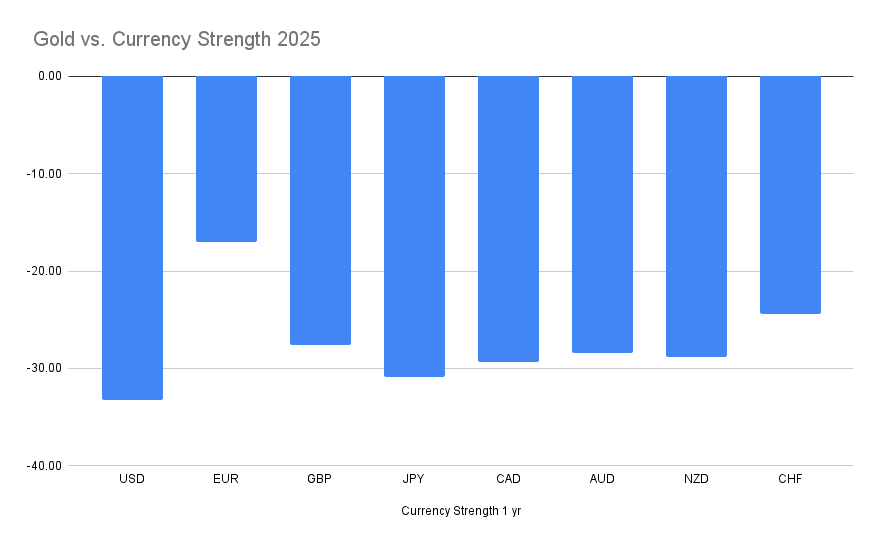
Currency strength vs. gold across four timelines (1-month, 3-month, 6-month, 1-year) provides a rare multi-horizon alignment. Several FX pairs consistently repeat across three or four time periods—offering the strongest conviction signals. Those trades form the core of the recommended strategy section.
The overall framework suggests:
- Risk-on environment supporting USD, GBP, AUD, and CAD.
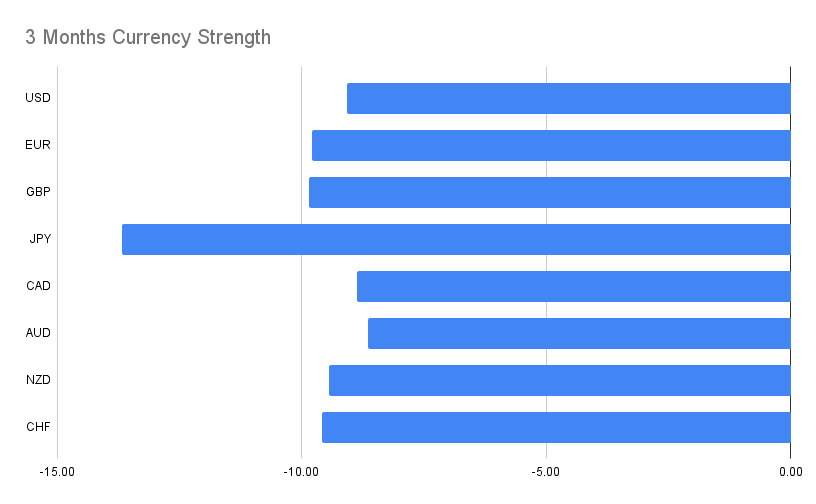
- JPY remains the structurally weakest due to ultra-low yields and relative underperformance on multi-timeline measures.
- CHF is losing ground vs gold across multiple timeframes, highlighting deteriorating defensive appeal.
- EUR remains caught in the middle, not weak enough to short universally, yet not strong enough to lead.
This report expands each macro dimension, integrates multi-horizon FX signals, and concludes with a unified trade table showing which pairs appear across 3 or 4 timelines, reflecting statistically persistent directional bias.
Global Macro Overview
Volatility Regime: VIX at 15.41
The VIX level of 15.41 reflects equity markets pricing a stable macro backdrop with limited near-term tail risks. This places markets firmly in a low-volatility, risk-on zone, typically associated with:
- Higher demand for carry trades
- Reduced appeal of safe-haven currencies (JPY, CHF)
- Greater sensitivity to yield differentials
The absence of outsized volatility suggests markets currently trust central banks to steer policy without shocking liquidity conditions.
But volatility metrics must be weighed against the Gold/Oil ratio, which tells a different story.
The Gold–Oil Ratio: A Deep Stress Warning
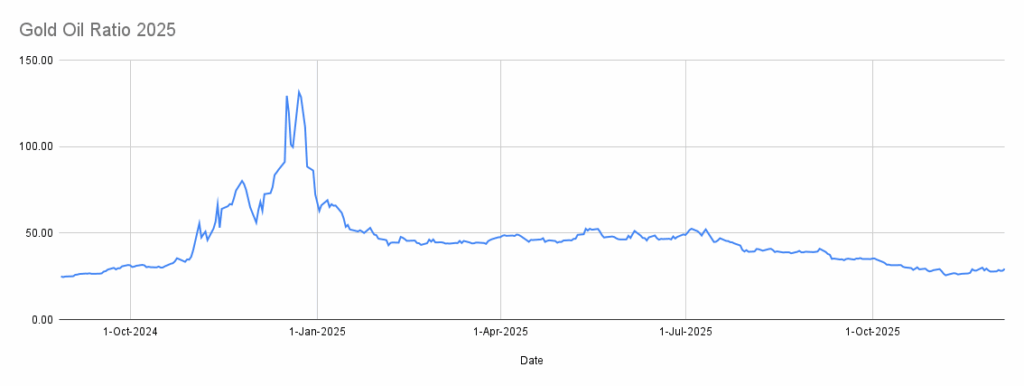
The Gold/Oil ratio at 69.80 is abnormally high despite declining from the previous week. Historically:
- Normal range: 10–30
- Current reading: 69.80
- Interpretation: severe imbalance between store-of-value demand (gold) and real-economy consumption (oil)
What this means macroeconomically:
- Gold is expensive relative to oil, driven by safe-haven accumulation.
- Oil demand is weaker than normal, signaling slowing industrial activity.
- Investors prefer defensive assets, contradicting the equity-led risk-on tone.
This divergence between market sentiment (VIX) and macro fundamentals (Gold/Oil) warns of potential mispricing in risk assets. When the ratio eventually normalizes, FX markets typically reprice:
- Commodity currencies strengthen (AUD, CAD)
- Low-yielders weaken (JPY, CHF)
Today’s ratio suggests we are not yet in that normalization phase, but the move is inevitable.
Central Bank Interest Rate Landscape

| Currency | Policy Rate | Macro Interpretation |
|---|---|---|
| USD | 4.00% | High carry; strong in risk-on regimes |
| GBP | 4.00% | Matching USD; attractive on yield |
| AUD | ~3.60%+ (from bond yield implications) | Supported by world-leading 10-year yield |
| CAD | ~2.25% | Moderate but supported by commodity links |
| EUR | 2.15% | Lower carry; stable but not aggressive |
| JPY | 0.50% | Structurally weak; used for funding |
| CHF | ~1% | Below major peers; weakening store-of-value credentials |
The clear picture:
High yielders: USD, GBP, AUD
Middle: CAD, NZD
Low: EUR, CHF
Very low: JPY
This ranking underpins multi-timeline FX trends where JPY weakens consistently, and USD/GBP/AUD outperform.
Global Yield Curve Dynamics
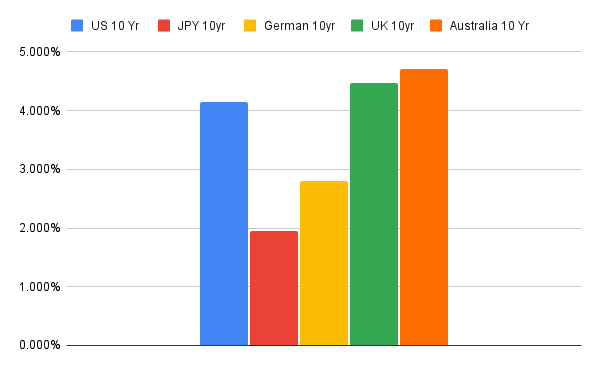
The 10-year government yield comparison (page 2) 6th December 2025 Weekly Analys… shows:
- Australia: ~4.7% (highest globally)
- UK: ~4.5% (second highest)
- US: ~4.1%
- Germany: ~2.8%
- Japan: ~2.0%
Implications:
1. AUD is fundamentally supported by world-leading yields.
2. GBP strength is structurally justified, not speculative.
**3. USD maintains a top-tier position in global capital flows.
4. EUR remains a low-yield alternative but not distressed.
5. JPY continues to face strong outflow pressure.
Yield spreads explain why pairs like AUDJPY, CADJPY, GBPJPY, USDJPY show multi-timeline directional alignment.
Safe-Haven vs Risk Trends
JPY: The Weakest Link
Across all four timelines, JPY consistently appears on the weaker side of nearly every cross.
Reason:
- Lowest 10-year bond yield
- 0.50% central bank policy rate
- Nikkei vs Gold ratio extremely low (0.077)
Result:
JPY is being used heavily for funding in carry trades, and multi-timeframe trade signals confirm this.
CHF: Erosion of Safe-Haven Premium
The Swiss franc shows:
- Low policy rate
- Weak performance vs gold in several multi-horizon measurements
Major Currency Breakdown
USD
Strength drivers:
- Third-highest sovereign yield among majors
- Strong equity performance relative to gold
- Risk-on environment favors USD carry
USD appears consistently on the strong side against EUR, GBP, AUD, NZD, CHF, and especially JPY.
EUR
A mixed performance currency:
- Low relative yields
- Solid but not exceptional economic stance
- Strength vs gold is moderate but not directional
EUR shows alternating BUY/SELL signals depending on the cross and timeframe—consistent with a currency lacking decisive macro identity.
GBP
High yield + high bond returns = strong currency.
A recurring BUY against low-yielders, but weak vs USD (due to equal policy rate but stronger US growth dynamics).
AUD
Highest 10-year bond yield globally → robust support.
AUD appears repeatedly as a SELL in shorter-term timelines (December) due to gold/oil dynamics, but longer-term macro favors AUD BUY signals.
This reflects near-term stress vs long-term structural advantage.
NZD
Weak across multiple periods, closely tied to:
- Lower yield vs AUD/CAD
- Sensitivity to risk
- Underperformance vs gold
Appears frequently as a SELL across all timelines.
Commodities & FX Correlations
Oil Weakness → CAD headwind in short term
But CAD retains medium-term strength due to yield advantage over CHF, JPY.
Gold strength → pressure on CHF & JPY
Both appear consistently weak across multi-horizon signals.
Market Risks & Forward Guidance
Top forward-looking risks:
- Gold–Oil ratio normalization → large FX repricing event potential
- Chinese industrial demand swing → AUD and NZD volatility
- BoJ policy drift → any hint of tightening could reverse JPY weakness sharply
- ECB navigating slow growth and weak inflation
- UK inflation persistence supporting GBP yield premium
The macro picture favors carry trades, but with caution due to contradictory Gold/Oil stress signals.
Timeline 4 Trades
(Appear in all 4 periods: December, 3-Month, 6-Month, 1-Year)
| Pair | Direction | Appears In |
| CADJPY | BUY | Dec, 3M, 6M, 1Y |
| CHFJPY | BUY | Dec, 3M, 6M, 1Y |
| EURJPY | BUY | Dec, 3M, 6M, 1Y |
| EURUSD | SELL | Dec, 3M, 6M, 1Y |
| GBPUSD | SELL | Dec, 3M, 6M, 1Y |
Timeline 3 Trades
(Appear in exactly 3 of the 4 periods)
| Pair | Direction | Appears In |
| AUDCAD | BUY | 3M, 6M, 1Y |
| AUDJPY | BUY | 3M, 6M, 1Y |
| AUDNZD | BUY | 3M, 6M, 1Y |
| AUDUSD | BUY | 3M, 6M, 1Y |
| CADCHF | SELL | Dec, 6M, 1Y |
| EURCAD | BUY | Dec, 6M, 1Y |
| EURGBP | BUY | Dec, 6M, 1Y |
| EURNZD | BUY | Dec, 6M, 1Y |
| GBPCHF | SELL | Dec, 6M, 1Y |
| GBPJPY | BUY | 3M, 6M, 1Y |
| GBPNZD | BUY | Dec, 6M, 1Y |
| NZDJPY | BUY | 3M, 6M, 1Y |
| NZDUSD | SELL | Dec, 3M, 6M |
| USDCHF | SELL | Dec, 3M, 1Y |
| USDJPY | BUY | Dec, 3M, 6M |
Conclusion
Macro conditions entering December highlight a rare combination of risk-on sentiment and deep structural stress signals. The suppressed VIX, strong equity ratios, and global yield leadership from the US, UK, and Australia pull capital toward higher-yielding currencies. At the same time, the historically extreme Gold/Oil ratio warns that the underlying economy is not as stable as markets currently imply.