A Macro-FX Assessment of Risk Sentiment, Relative Value, and High-Conviction Trade Structures
Global FX markets are currently navigating a nuanced macro environment characterized by surface-level risk appetite alongside deep-rooted structural stress signals. While equity markets and volatility metrics suggest a broadly risk-on regime, cross-asset indicators—particularly the gold-to-oil ratio, currency strength versus gold, and sovereign yield differentials—tell a more complex story.
Gold remains structurally expensive relative to oil, highlighting persistent macro uncertainty beneath improving sentiment indicators. Bond markets reinforce this dual narrative: higher-yielding jurisdictions such as Australia, the UK, and the United States continue to attract capital, yet traditional safe havens like the Japanese yen remain deeply suppressed due to ultra-accommodative monetary policy.
This report synthesizes market sentiment indicators, interest-rate and yield dynamics, currency performance relative to gold, and equity-to-gold ratios to frame a coherent macro thesis. From this framework, a focused Gold strength confluence between 3 and 4 time lines high probability trade structures emerges.
Global Macro Overview
Market Sentiment: Volatility Remains Suppressed
The VIX index, currently at 15.74, remains comfortably below historical stress thresholds. This level is consistent with an environment of controlled risk appetite, where investors are willing to allocate toward equities and higher-yielding assets without demanding significant volatility premiums.
However, low volatility alone should not be mistaken for macro stability. Historically, extended periods of suppressed volatility often coexist with latent imbalances that surface abruptly when catalysts emerge. As such, volatility should be interpreted in conjunction with cross-asset valuation signals rather than in isolation.
The Gold-to-Oil Ratio: A Structural Stress Indicator
The gold-to-oil ratio currently stands at 74.76, a level far above its historical norm of 10–30. While the ratio has declined from the prior week, it remains structurally elevated, signaling continued economic tension beneath the surface.
This imbalance reflects two concurrent forces:
- Gold remains expensive, supported by persistent demand for safety and long-term hedging.
- Oil prices are depressed, indicating weak demand expectations and subdued industrial activity.
Such conditions are typically observed during periods of economic uncertainty, where capital seeks monetary safety while real-economy consumption slows. Although short-term sentiment appears constructive, this ratio argues against complacency and supports a selective, asymmetric FX positioning approach
Rates and Yield Differentials: The Backbone of FX Flows
Central Bank Policy Snapshot
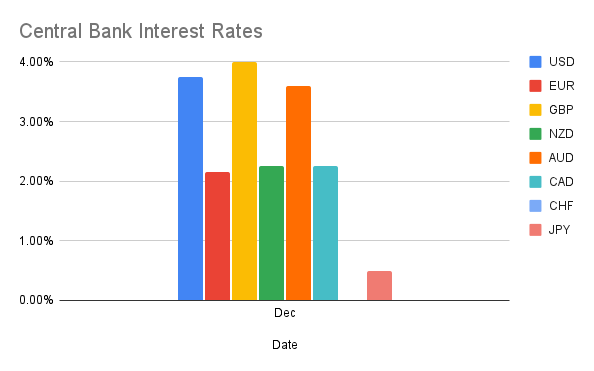
Relative monetary policy remains a primary driver of medium- to long-term currency trends:
- GBP and USD lead with 4.00% and 3.75% policy rates, respectively.
- EUR sits at 2.15%, offering moderate yield but lagging carry appeal.
- JPY remains anchored at 0.50%, firmly positioned as the global funding currency.
This hierarchy creates persistent incentives for carry trades, particularly against the yen, while also reinforcing demand for higher-yielding currencies during periods of stable risk sentiment
10-Year Government Bond Yields
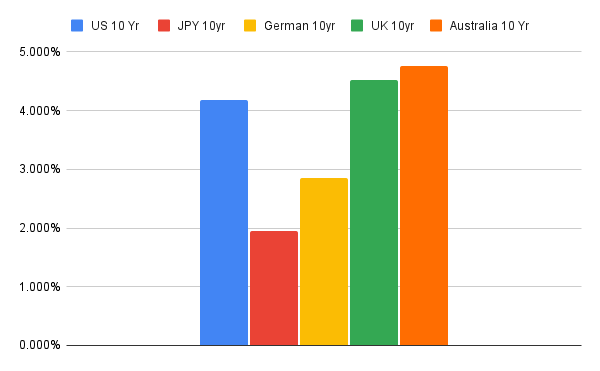
Long-term yields further validate this structure:
- Australia leads with the highest 10-year yield, reinforcing AUD’s relative strength.
- United Kingdom follows closely, offering strong term premium support for GBP.
- United States remains competitive, ranking just behind the UK and Australia.
- Japan continues to anchor the low-yield spectrum, consistent with long-standing yield-curve control dynamics.
These yield differentials form the foundation for several of the high-conviction trade ideas discussed later in this report, particularly those involving JPY crosses and AUD-linked structures
Currency Strength vs Gold: Relative Value in Focus
Gold-denominated currency analysis offers a clean, inflation-adjusted lens through which to assess true purchasing-power performance.
One-Year Perspective
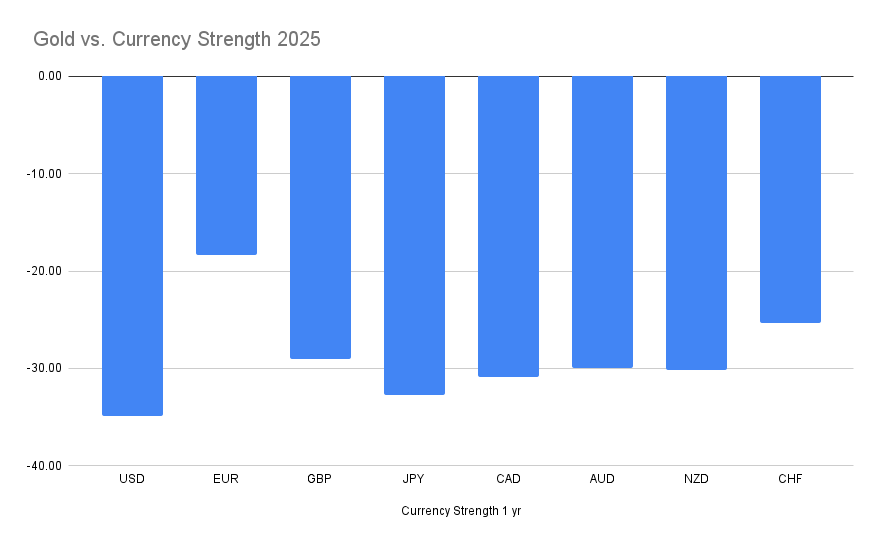
Over the one-year horizon, all major currencies remain weaker relative to gold, reinforcing gold’s role as the dominant store of value during ongoing macro uncertainty. However, the degree of underperformance varies meaningfully across currencies, creating actionable dispersion.
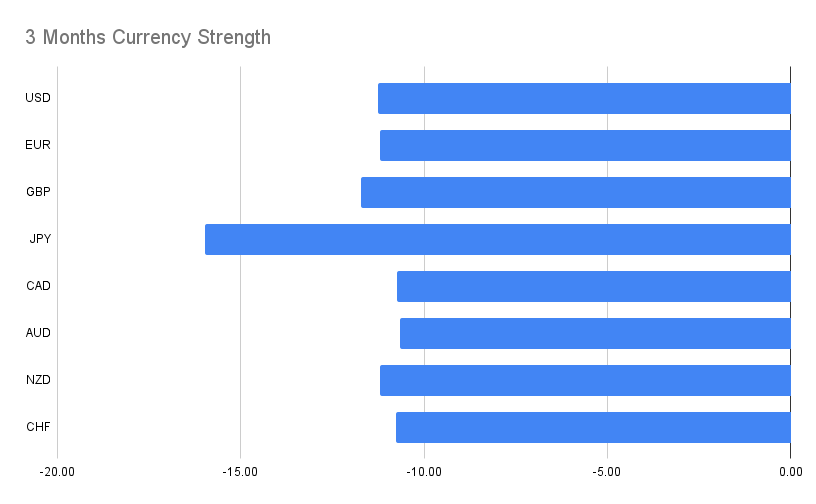
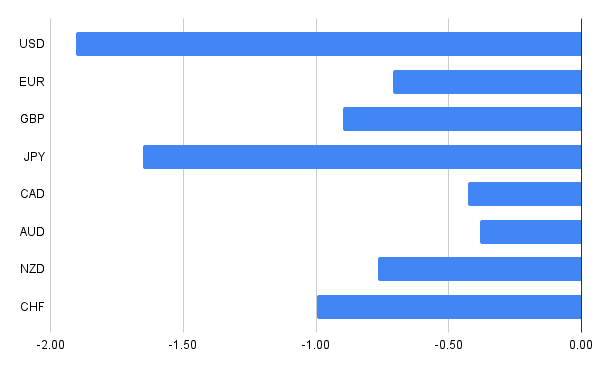
Six-Month and Three-Month Trends
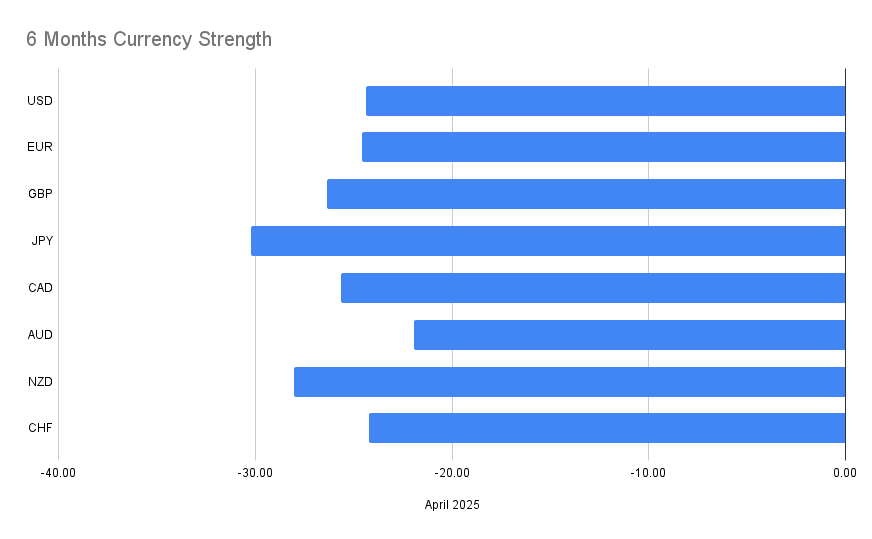
Shorter-term momentum reveals important shifts:
- USD, EUR, and GBP have stabilized versus gold, reflecting improved sentiment.
- JPY remains deeply weak, consistent with its yield disadvantage.
- AUD and NZD exhibit improving relative strength, aligning with yield support and risk-on flows.
These time-frame alignments are critical, as the strongest trade opportunities emerge where multiple horizons confirm the same directional bias
Equities vs Gold: Risk Confirmation Signals
United States
The S&P 500 vs Gold ratio sits at 1.59, suggesting equities are holding ground but are not aggressively outperforming gold. This aligns with a measured risk-on posture rather than outright exuberance.
Europe
- DAX vs Gold at 6.60 sits near historical averages.
- CAC 40 vs Gold at 2.20 remains below its typical range of 4–5, indicating relative underperformance within European equities.
Despite lower yields, the euro remains resilient, suggesting capital inflows driven more by relative stability than by yield appeal.
United Kingdom
The FTSE 100 vs Gold ratio at 3.00, combined with elevated bond yields, supports GBP’s continued macro relevance, particularly in carry-friendly environments.
Japan
The Nikkei 225 vs Gold ratio of 0.076 sits near the lower bound of historical norms, reinforcing the view that Japanese assets remain structurally disadvantaged versus gold, consistent with persistent JPY weakness.
Major Currency Breakdown
USD
- Competitive yields and stable equity performance.
- Beneficiary of risk-on flows, but not excessively dominant.
- Best expressed via selective pair structures rather than broad USD longs.
EUR
- Yield-disadvantaged but fundamentally resilient.
- Performs well in relative-value setups, particularly versus GBP and JPY.
GBP
- Strong yield support and solid equity backing.
- Best deployed selectively against lower-yielding or commodity-linked counterparts.
JPY
- Structural underperformer due to ultra-low rates.
- Remains the preferred funding currency across multiple timeframes.
AUD & NZD
- Supported by high yields (AUD in particular).
- Benefit from risk-on sentiment and perform well in JPY and CHF crosses.
CAD
- Exhibits relative weakness in several gold-based comparisons.
- Vulnerable in environments where oil demand remains subdued.
Trades (Timeline 3 & 4 Only)
The following trades are derived exclusively from positions confirmed across Timeline 3 and Timeline 4 vs Gold, ensuring multi-horizon alignment and higher conviction.
Positions confluence in 3 Timeframes
- EURUSD — BUY
- USDCAD — SELL
- EURAUD — SELL
- GBPCAD — SELL
- GBPAUD — SELL
- NZDJPY — BUY
- NZDCAD — SELL
- AUDNZD — BUY
- AUDCHF — BUY
- GBPCHF — SELL
Positions Confluence Across All Four Timeframes
These represent the highest-confidence macro alignments:
- AUDUSD — BUY
- USDCHF — SELL
- EURGBP — BUY
- EURJPY — BUY
- EURNZD — BUY
- GBPJPY — BUY
- CADJPY — BUY
- AUDJPY — BUY
- CHFJPY — BUY
- AUDCAD — BUY
- NZDCHF — SELL