A New Year, a New Market Regime: Positioning FX Portfolios for 2026
Happy New Year and Welcome to the First Macro Outlook of 2026
As we step into a new calendar year, I would like to wish all readers a Happy New Year and a successful, disciplined, and profitable 2026. The turn of the year is not just a psychological reset—it is often a structural one. Portfolio rebalancing, institutional capital rotation, and fresh macro narratives tend to emerge in January, making this an especially important period for macro-FX traders to reassess positioning with clarity and objectivity.
This report synthesizes volatility metrics, safe-haven signals, yield structures, equity-to-gold ratios, and currency strength versus gold to define the dominant macro regime and extract high-probability FX opportunities. As always, the objective is not prediction, but probabilistic positioning.
Global markets are entering 2026 with subdued volatility, elevated but easing safe-haven demand, and a macro backdrop that still reflects underlying economic stress beneath surface-level risk appetite.
Key themes this week include:
- Low implied volatility (VIX near mid-teens) suggesting complacency rather than systemic fear
- Persistently elevated Gold-to-Oil ratio, signaling weak global demand and latent macro fragility
- Yield differentials continuing to favor USD, AUD, and GBP over JPY and CHF
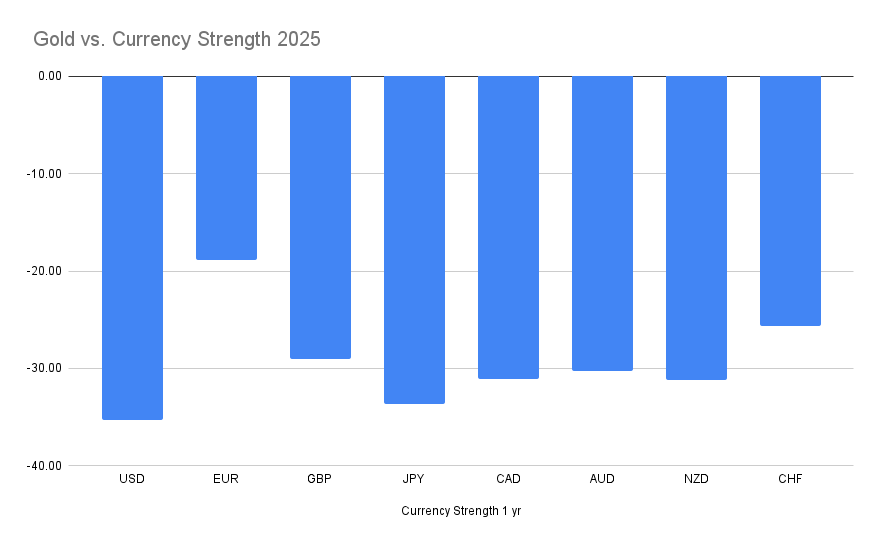
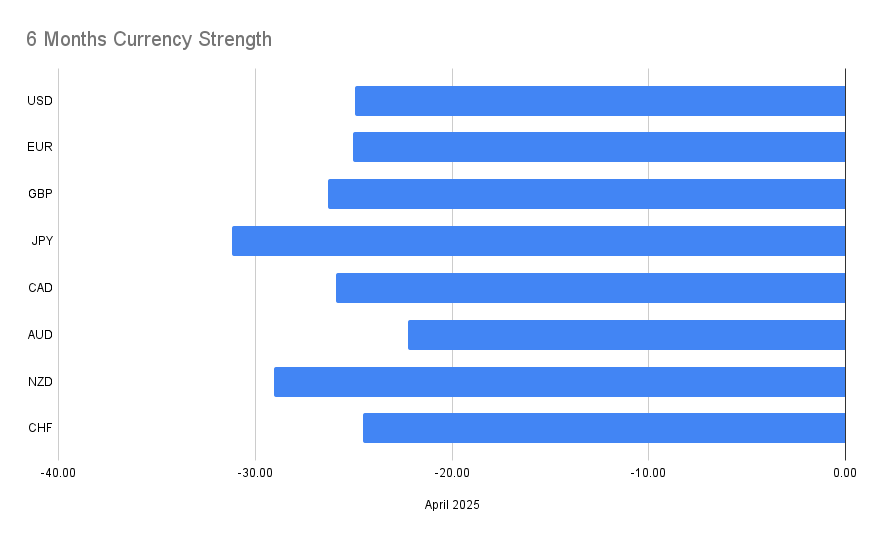
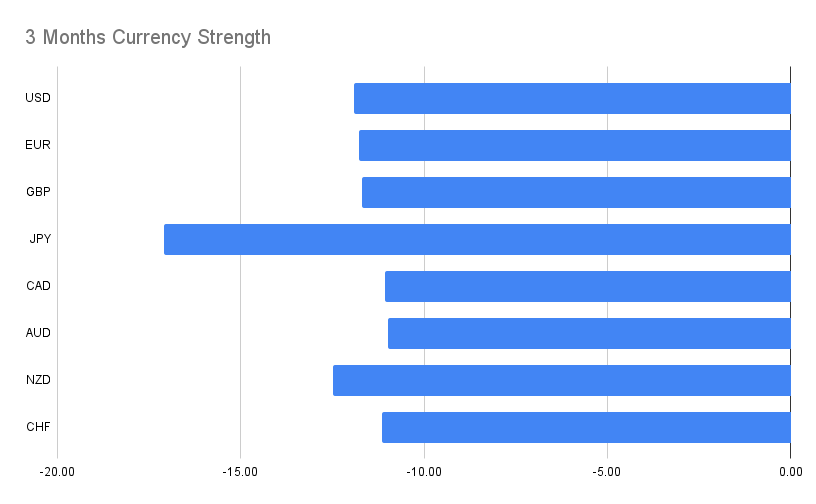
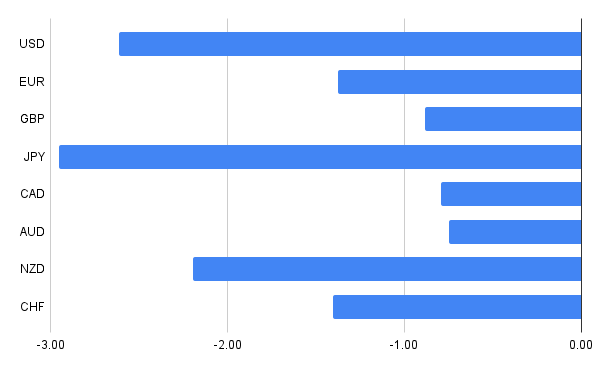
- Gold outperforming all major currencies over 1-year horizons, confirming long-term monetary debasement trends
- JPY remaining structurally weak, reinforcing multi-JPY-cross bullish setups
From a positioning standpoint, the data supports:
- Selective risk-on carry exposure, particularly against JPY
- Tactical USD positioning rather than broad-based dollar dominance
- Continued pressure on commodity-linked currencies relative to gold in longer horizons
The trade section focuses strictly on high-confluence setups appearing in Timeline 3 and Timeline 4 of the Strength measured in Gold, ensuring alignment across medium- and longer-term macro structures.
Global Macro Overview
Volatility and Market Psychology
The VIX currently sits near 14.5, firmly within a low-volatility regime. Historically, such levels imply confidence—or complacency—rather than outright optimism. Markets are not pricing immediate systemic risk, yet they are also not expressing strong directional conviction.
Low volatility environments tend to:
- Favor carry trades
- Penalize defensive hedging
- Mask underlying macro stress until a catalyst emerges
This context demands tight risk management and a preference for structural macro alignment rather than short-term momentum chasing.
The Gold-to-Oil Ratio: Stress Beneath the Surface
The Gold-to-Oil ratio remains elevated at approximately 75, although it has declined meaningfully from last week. To put this into perspective:
- Long-term historical norms range between 10 and 30
- Current levels imply that gold is extremely expensive relative to oil
- Such conditions typically arise during economic stress, weak industrial demand, or deflationary pressures
While equity markets may signal resilience, the commodity complex tells a more cautious story. Oil weakness reflects soft global demand, while gold strength reflects capital preservation and distrust in fiat purchasing power.
This divergence is critical: it suggests that risk-on conditions may be tactical, not structural.
Safe-Haven vs Risk Dynamics
Gold vs Equities
Key equity-to-gold ratios provide insight into regional risk sentiment:
- S&P 500 vs Gold: 1.58
This ratio supports a mild risk-on interpretation, consistent with stable US yields and equity performance. - DAX vs Gold: 6.64
Near average historical levels, suggesting balanced sentiment in core Europe. - CAC 40 vs Gold: 2.22
Below historical averages, indicating relative weakness and risk sensitivity in French equities. - Nikkei 225 vs Gold: 0.074
Extremely low, reinforcing Japan’s persistent underperformance and safe-haven capital outflows.
The takeaway is nuanced: risk appetite exists, but it is uneven and region-specific, with Japan remaining the clearest outlier.
Rates, Yields, and Monetary Structure
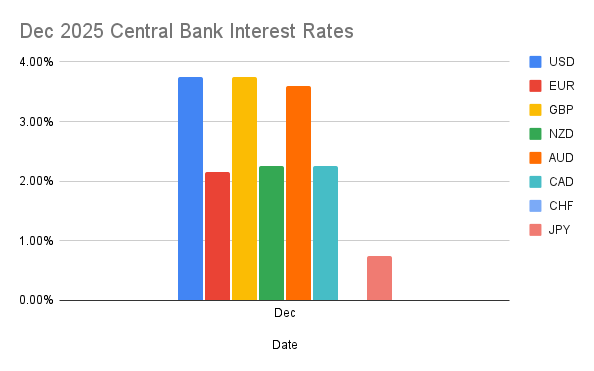
Central Bank Policy Snapshot
- USD: ~3.75%
- GBP: ~3.75%
- AUD: ~3.60%
- EUR: ~2.15%
- CAD: ~2.25%
- JPY: ~0.75%
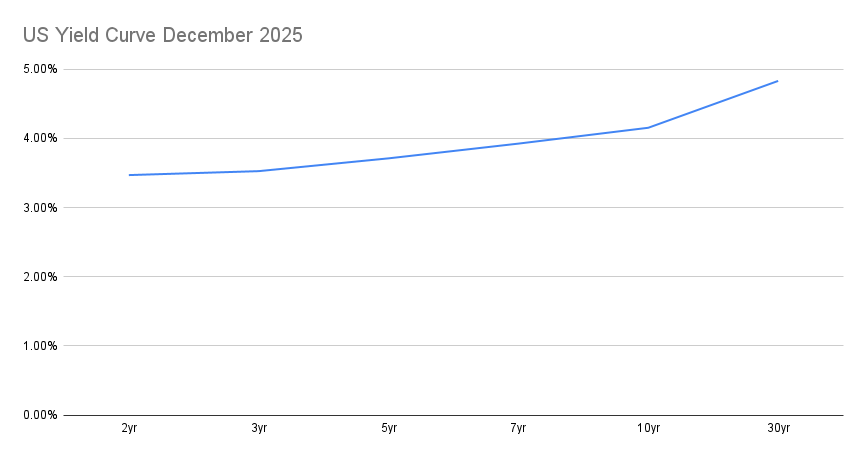
10-Year Government Bond Yields
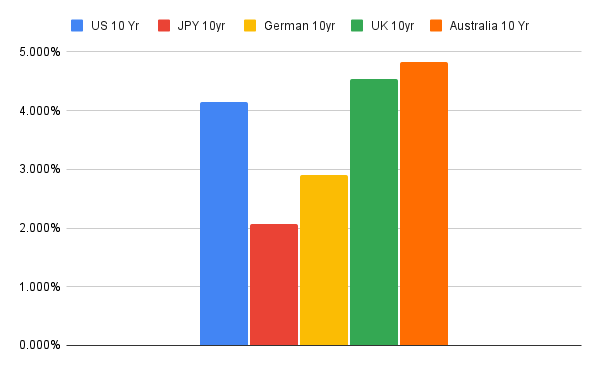
- Australia: ~4.82% (highest)
- UK: ~4.54%
- United States: ~4.20%
- Germany: ~2.91%
- Japan: ~2.07%
Yield spreads strongly favor AUD, GBP, and USD, particularly against JPY. This continues to support carry trade structures, especially when volatility remains contained.
Commodities and FX Correlations
The divergence between gold and oil remains one of the most important macro signals. Weak oil prices imply:
- Soft global growth
- Reduced industrial demand
- Pressure on commodity-linked currencies
Gold strength, meanwhile, confirms:
- Ongoing hedging against macro instability
- Persistent distrust in fiat systems
FX positioning should respect this divergence by avoiding over-exposure to growth-sensitive currencies without yield compensation.
Recommended Trades
(Timeline 3 & Timeline 4 Only)**
Below are high-confluence trade ideas that appear consistently across medium- and longer-term timelines. These setups are rooted in relative strength.
USDCHF — SELL
EURJPY — BUY
EURNZD — BUY
GBPJPY — BUY
GBPNZD — BUY
CADJPY — BUY
AUDJPY — BUY
NZDJPY — BUY
CHFJPY — BUY
AUDCAD — BUY
AUDNZD — BUY
NZDCAD — SELL
NZDCHF — SELL
EURUSD — BUY
USDJPY — BUY
USDCAD — SELL
AUDUSD — BUY
NZDUSD — SELL
EURAUD — SELL
EURCHF — BUY
GBPCAD — SELL
GBPAUD — SELL
AUDCHF — BUY
CADCHF — BUY
Market Risks and Forward Guidance
Key risks to monitor in early 2026:
- Sudden volatility expansion after prolonged compression
- Oil price shocks impacting commodity FX
- Unexpected central-bank rhetoric shifts
- Geopolitical catalysts re-pricing safe-haven demand
Traders should remain flexible, scaling exposure as volatility evolves and reassessing gold-based signals weekly.
Conclusion
The start of 2026 presents a measured, asymmetric opportunity set for FX traders. While surface-level indicators suggest stability, deeper macro relationships—particularly gold-based metrics—continue to warn against complacency.
The dominant themes remain:
- Structural JPY weakness
- Tactical risk-on behavior within a fragile macro environment
- Gold as the ultimate long-term outperformer
By focusing on timeline-aligned, relative-strength trades, traders can participate in market opportunities while respecting the broader macro risk landscape.
Trade with discipline. Respect risk. And once again—Happy New Year, and welcome to the first macro chapter of 2026.