Takezo Trading | 20/03/26
Reading Time: ~12–15 minutes
Executive Summary — The Battlefield Overview
This week was not subtle. Markets were forced into a confrontation between geopolitical escalation and cross-asset repricing, and the result is a fragile, unstable equilibrium.
This Week’s Bottom Line
- Macro Driver: Geopolitical escalation (USA–Iran conflict) feeding directly into inflation expectations via energy markets
- Market Regime: Risk-on positioning persists, but under extreme fragility—structurally unstable
- Key Risks:
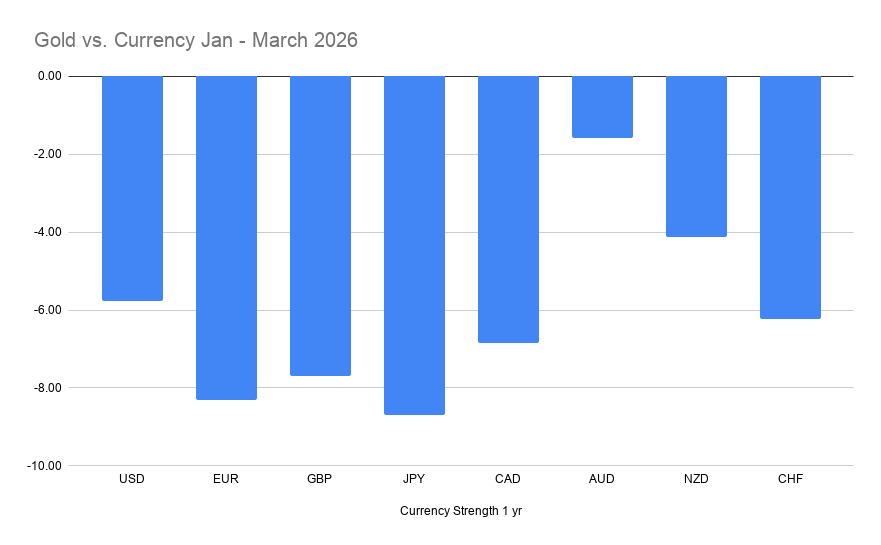
- Gold experienced a sharp corrective sell-off, signaling repositioning rather than safety demand collapse
- Oil prices rising amid supply disruptions
- Closure of the Strait of Hormuz, a critical global energy chokepoint
- War-driven supply chain disruptions → inflationary spillovers across global economies
The Macro Narrative — War, Energy, and the Illusion of Stability
Markets are currently caught between two opposing forces:
- Short-term: Flight to safety (traditional response to war)
- Medium-to-long-term: Structural inflation shock (energy + supply disruption)
This contradiction creates what can best be described as a “false equilibrium”—markets appear stable, but the underlying conditions are highly unstable.
The closure of the Strait of Hormuz is not just a geopolitical headline—it is a macro catalyst. A significant portion of global oil supply flows through this corridor. Its disruption introduces:
- Higher transportation costs
- Increased production costs globally
- Embedded inflation across supply chains
This is not temporary noise—it is systemic inflation pressure.
Risk Regime — The Carry Trade Time Bomb
One of the most underappreciated risks right now is the Japanese carry trade.
Why it matters:
- Japan relies heavily on imported energy, especially oil
- Rising oil prices → higher domestic inflation
- This forces the Bank of Japan into a corner:
- Either tolerate inflation
- Or raise rates
If rates rise in Japan:
- The carry trade (borrow JPY, invest in higher-yield currencies) begins to unwind
- This triggers:
- Global liquidity contraction
- Forced deleveraging
- Potential systemic risk event
This is how a regional war evolves into a global financial crisis catalyst.
Bias Map — Strategic Positioning
Pro-Risk Forces
- Carry trade still active (for now)
- War-driven fiscal expansion (historically inflationary)
- Rising oil prices reinforcing global liquidity flows
However, this “pro-risk” stance is fragile and conditional.
Anti-Risk Forces
- Elevated volatility (VIX at 26.78)
- Ongoing regional war involving major global powers
- Structural uncertainty in global trade routes
Highest Conviction (Aligned Across ALL 4 Timeframes)
Directional Consensus Trades:
- EURUSD – SELL
- GBPUSD – SELL
- USDJPY – BUY
- USDCAD – BUY
- USDCHF – BUY
- EURGBP – SELL
- EURCAD – SELL
- EURAUD – SELL
- GBPJPY – BUY
- GBPCAD – SELL
- CADJPY – BUY
- AUDJPY – BUY
- CADCHF – SELL
- AUDNZD – BUY
- AUDCHF – BUY
Secondary Conviction (Aligned Across 3 Timeframes)
- AUDUSD – BUY
- NZDUSD – BUY
- EURJPY – BUY
- EURNZD – SELL
- EURCHF – SELL
- GBPAUD – SELL
- GBPNZD – SELL
- GBPCHF – SELL
- NZDJPY – BUY
- CHFJPY – BUY
- AUDCAD – BUY
- NZDCAD – BUY
- NZDCHF – BUY
Market Snapshot — Cross-Asset Intelligence
Interest Rate Landscape
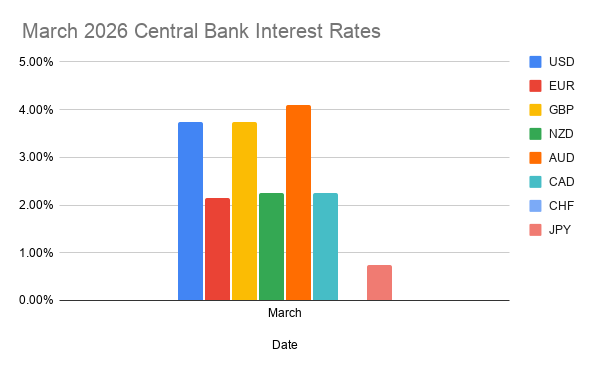
- USD: 3.75%
- GBP: 3.75%
- AUD: 4.10% (highest among majors)
- EUR: 2.15%
- CAD: 2.25%
- NZD: 2.25%
- JPY: 0.75%
- CHF: 0%
10-Year Bond Yields
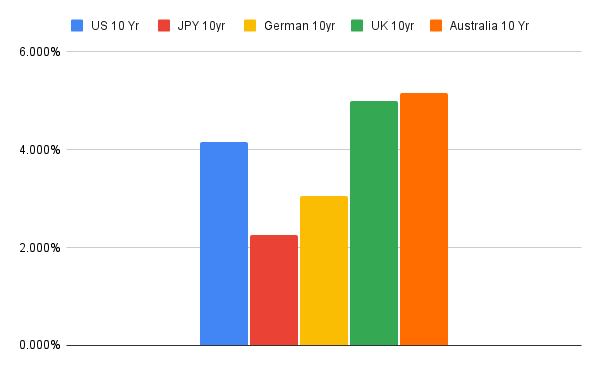
- AUD: 5.162%
- GBP: 4.997%
- USD: 4.384%
- EUR: 3.048%
- JPY: 2.264%
Equity vs Gold Ratios
- S&P 500 vs Gold: 1.45
- DAX vs Gold: 5.77
- Nikkei vs Gold: 0.075
Volatility
- VIX: 26.78
Commodities — The Critical Signal
- Gold/Oil Ratio: 45.84
This ratio is key.
A falling ratio (driven by rising oil or falling gold) signals:
- Increasing inflation pressure
- Economic stress building beneath the surface
This aligns perfectly with current conditions.