Takezo Trading | 11/04/26
Reading Time: 8–10 minutes
This week’s macro landscape is defined by one dominant force: geopolitical escalation and its inflationary consequences.
- Macro Driver: War-driven supply shock (USA–Iran conflict)
- Market Regime: Risk-on… but fragile beneath the surface
- Core Theme: Inflation resurgence through energy channels
- Underlying Tension: Carry trade stability vs systemic unwind risk
Key Risks Developing
- Gold consolidation after extended upside — signaling a temporary pause, not reversal
- Oil prices rising aggressively, fueled by supply disruption
- Closure of the Strait of Hormuz, restricting global energy flow
- Escalating geopolitical conflict, with spillover risks into Europe
The market is currently behaving as if it is risk-on, but structurally it is sitting on a macro fault line.
Macro Framework — The Carry Trade Time Bomb
At the center of this week’s outlook lies a critical structural dynamic:
- Japan depends heavily on imported energy
- The closure of the Strait of Hormuz directly impacts oil supply
- Rising energy costs = inflation pressure in Japan
- This forces the Bank of Japan (BOJ) toward tightening
This is where the second-order effect emerges:
If the BOJ raises rates → Carry trades begin to unwind → Global liquidity tightens → Risk assets reprice
This is not just a regional issue.
This is a global systemic risk trigger.
Risk Positioning
Pro-Risk Forces
- Continued carry trade participation
- Inflation-driven asset support
- Market complacency despite geopolitical escalation
Anti-Risk Forces
- Elevated gold prices
- VIX at 19.23 — not panic, but no longer complacent
- Expanding Middle Eastern conflict involving the USA
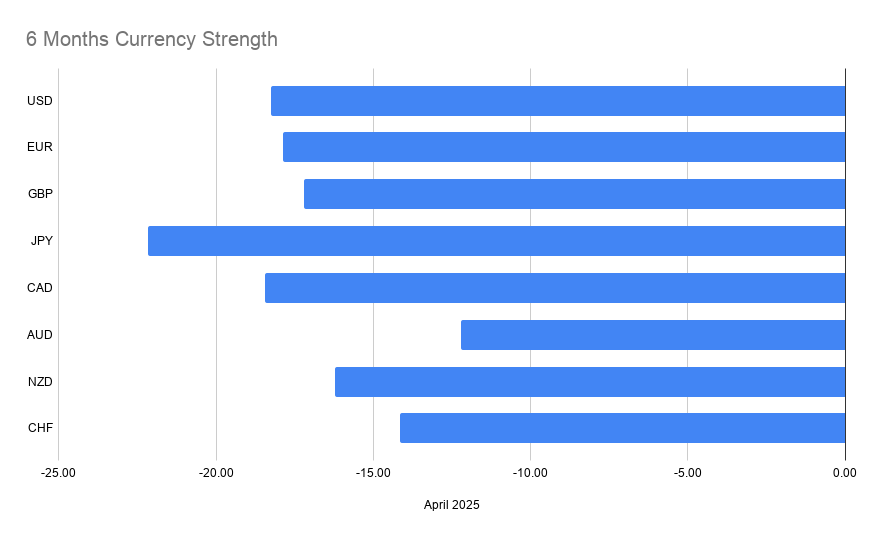
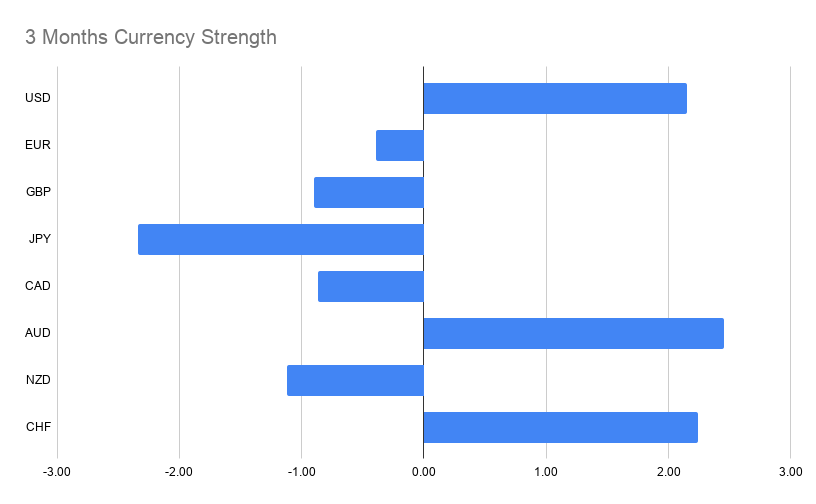
FX Watchlist — Multi-Timeframe Alignment
This week’s trade selection is based on Gold vs Currency alignment across timeframes, giving us high-confidence directional bias.
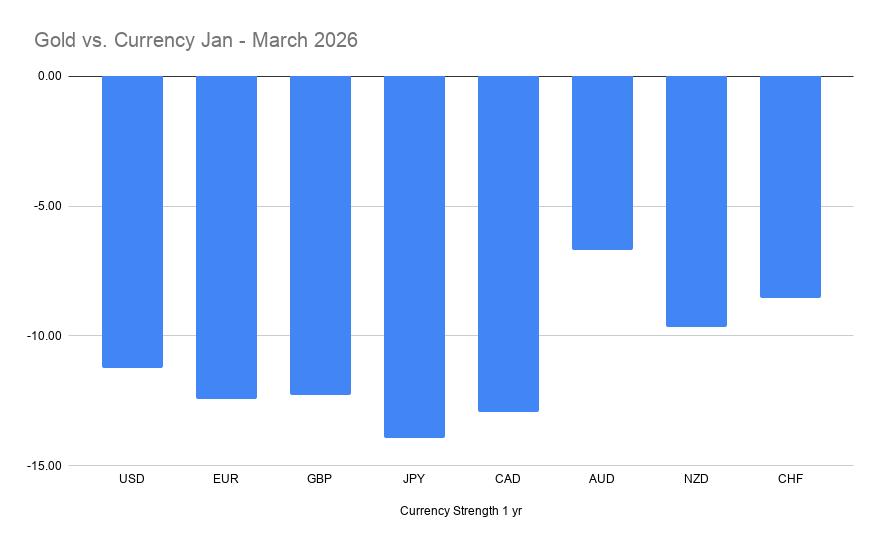
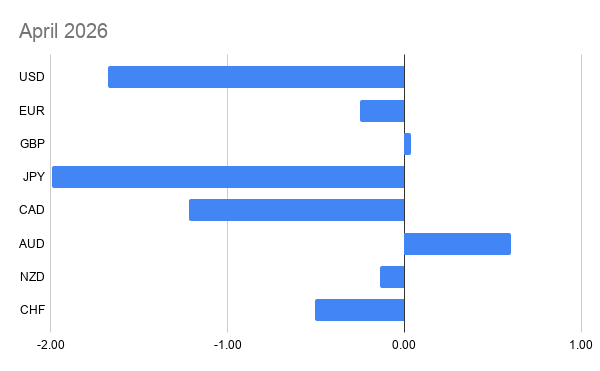
High Conviction — Aligned Across ALL Timeframes
- USDJPY – BUY
- AUDUSD – BUY
- EURJPY – BUY
- EURCAD – BUY
- EURAUD – SELL
- GBPJPY – BUY
- GBPAUD – SELL
- CADJPY – BUY
- AUDJPY – BUY
- NZDJPY – BUY
- CHFJPY – BUY
- AUDCAD – BUY
- CADCHF – SELL
- AUDNZD – BUY
- AUDCHF – BUY
Secondary Setups — Aligned Across 3 Timeframes
- NZDCHF – SELL
- USDCAD – BUY
- NZDUSD – BUY
- USDCHF – SELL
- EURGBP – SELL
- EURNZD – SELL
- EURCHF – SELL
- GBPCAD – BUY
- GBPCHF – SELL
- NZDCAD – BUY
Interest Rate Landscape
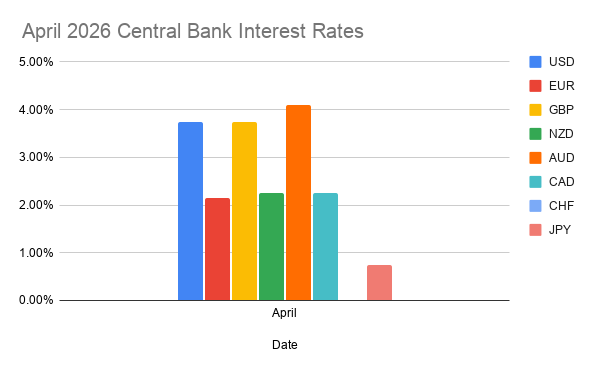
| Currency | Rate |
|---|---|
| USD | 3.75% |
| EUR | 2.15% |
| GBP | 3.75% |
| NZD | 2.25% |
| AUD | 4.10% |
| CAD | 2.25% |
| CHF | 0% |
| JPY | 0.75% |
10-Year Bond Yields
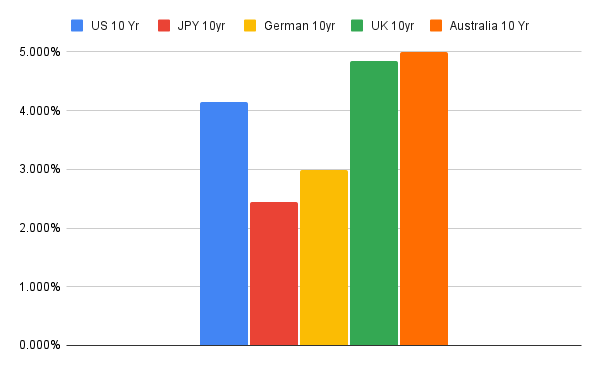
- USD: 4.317%
- JPY: 2.447%
- EUR: 3.054%
- GBP: 4.835%
- AUD: 4.993%
Equity vs Gold Ratios
- S&P 500 vs Gold: 1.44
- DAX vs Gold: 5.88
- CAC40 vs Gold: 2.04
- FTSE 100 vs Gold: 3.01
- Nikkei 225 vs Gold: 0.075
Volatility & Commodities
- VIX: 19.23
- Gold/Oil Ratio: 49.66
For deeper context on this relationship:
https://takezotrading.com/the-gold-to-oil-ratio-a-historical-and-practical-guide/
COT Context — Positioning Matters
For the latest Commitment of Traders positioning breakdown: