

By Takezo Trading | www.takezotrading.com
Methodology
Gold serves as a neutral benchmark for measuring currency strength. By comparing how each major currency has performed against gold across four different timeframes — April 2026, 3 Months, 6 Months, and Year-to-Date 2026 — we can rank relative strength and identify high-conviction pair trades.
The rule is simple:
- Buy the strongest currency vs. gold
- Sell the weakest currency vs. gold
- Confluence across timeframes = higher-conviction trades
Pairs that show the same directional bias in all 4 timeframes carry the strongest signal. Pairs that show alignment in 3 of 4 timeframes are still worth watching — the broken timeframe just gives us context about where the trend has wobbled.
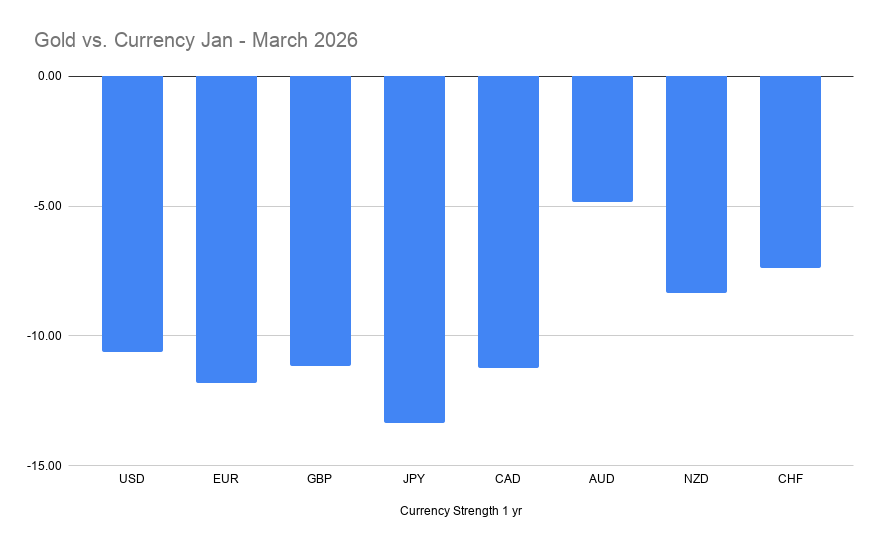
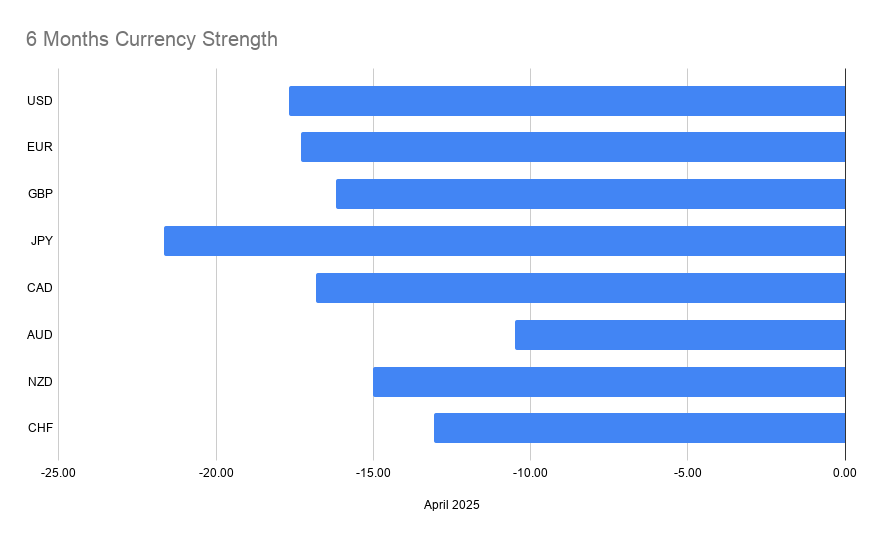
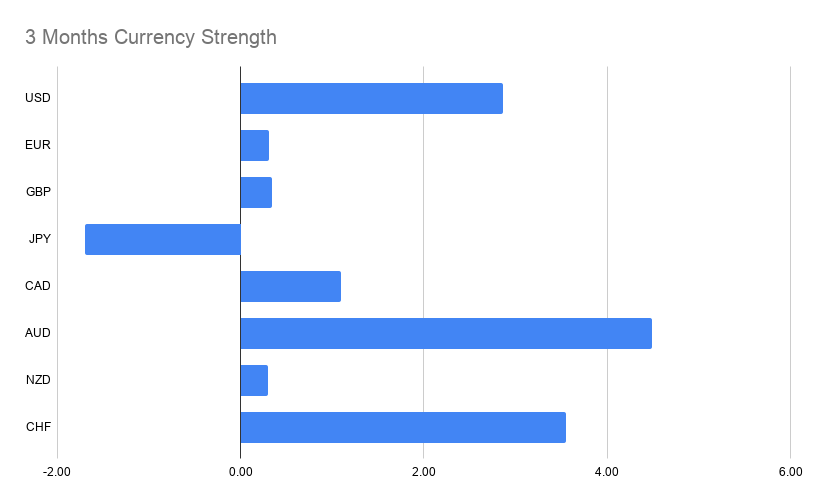
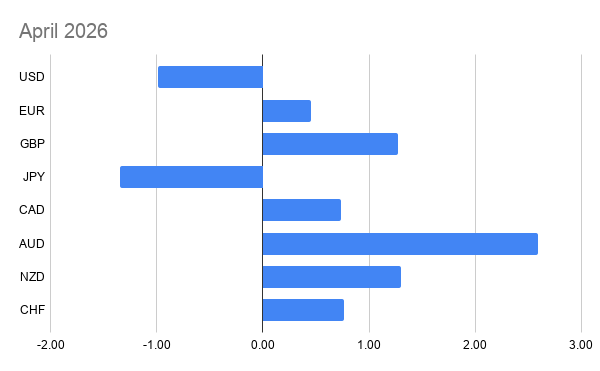
Currency Strength Rankings (Strongest → Weakest)
| Rank | April 2026 | 3 Months | 6 Months | YTD 2026 |
|---|---|---|---|---|
| 1 | AUD (+2.60) | AUD (+4.50) | AUD (-10.50) | AUD (-5.00) |
| 2 | GBP (+1.30) | CHF (+3.50) | CHF (-13.00) | CHF (-7.50) |
| 3 | NZD (+1.30) | USD (+2.80) | NZD (-15.00) | NZD (-8.50) |
| 4 | CAD (+0.70) | CAD (+1.10) | GBP (-16.00) | USD (-10.50) |
| 5 | CHF (+0.70) | EUR (+0.30) | EUR (-17.00) | GBP (-11.00) |
| 6 | EUR (+0.40) | GBP (+0.30) | CAD (-17.00) | CAD (-11.50) |
| 7 | USD (-1.00) | NZD (+0.30) | USD (-17.50) | EUR (-12.00) |
| 8 | JPY (-1.40) | JPY (-1.70) | JPY (-21.50) | JPY (-13.50) |
Two clear extremes jump out immediately:
- AUD is the strongest currency in every single timeframe — top of the leaderboard from April back through the full year
- JPY is the weakest currency in every single timeframe — bottom of every list, by a wide margin
- CHF is the consistent #2 across the longer timeframes, only slipping in April
This sets up the highest-conviction pair on the entire board: long AUD/JPY — confirmed at every horizon you can throw at it.
Tier 1: Full Confluence Trades (4/4 Timeframes)
These pairs show the same strong/weak relationship across all four timeframes. These are the cleanest setups on the board.
AUD-Strength Plays
| Pair | Direction | Logic |
|---|---|---|
| AUD/JPY | LONG | Strongest vs. weakest — top-tier setup |
| AUD/USD | LONG | AUD outperforming USD across all horizons |
| AUD/CAD | LONG | Sustained AUD outperformance vs. CAD |
| AUD/NZD | LONG | AUD beating NZD even at the short timeframe |
| AUD/CHF | LONG | AUD edges ahead of CHF in every window |
| EUR/AUD | SHORT | EUR persistently weaker than AUD |
| GBP/AUD | SHORT | GBP can’t keep up with AUD |
JPY-Weakness Plays
| Pair | Direction | Logic |
|---|---|---|
| CHF/JPY | LONG | CHF dominates JPY across all timeframes |
| NZD/JPY | LONG | NZD outperforms despite Kiwi softness elsewhere |
| GBP/JPY | LONG | GBP firmly stronger than JPY |
| CAD/JPY | LONG | CAD ahead of JPY at every horizon |
| EUR/JPY | LONG | EUR clears JPY in every window |
| USD/JPY | LONG | USD outperforms JPY in every timeframe |
CHF-Strength Plays (outside the AUD/JPY axis)
| Pair | Direction | Logic |
|---|---|---|
| EUR/CHF | SHORT | CHF stronger than EUR in every timeframe |
| USD/CHF | SHORT | CHF outperforming USD across the board |
Total Tier 1 trades: 15
Tier 2: Strong Confluence Trades (3/4 Timeframes)
These pairs show alignment in three of the four timeframes. The “missed” timeframe is noted for each — useful context for entry timing and risk management.
| Pair | Direction | Where the Pattern Aligns | Where It Broke |
|---|---|---|---|
| NZD/CHF | SHORT | 3M, 6M, YTD | NZD edged CHF in April |
| GBP/CHF | SHORT | 3M, 6M, YTD | GBP edged CHF in April |
| CAD/CHF | SHORT | 3M, 6M, YTD | Tied in April |
| NZD/USD | LONG | April, 6M, YTD | USD beat NZD in 3M |
| EUR/NZD | SHORT | April, 6M, YTD | Tied in 3M |
| NZD/CAD | LONG | April, 6M, YTD | CAD beat NZD in 3M |
| EUR/GBP | SHORT | April, 6M, YTD | Tied in 3M |
| GBP/CAD | LONG | April, 6M, YTD | CAD beat GBP in 3M |
| EUR/CAD | SHORT | April, 3M, YTD | Tied in 6M |
Total Tier 2 trades: 9
What the 3/4 Patterns Are Telling Us
A few themes worth flagging in the Tier 2 list:
The 3-Month window is doing most of the breaking. Five of the nine 3/4 trades are interrupted specifically at the 3-month timeframe. That timeframe captured a stretch where USD and CAD had a brief surge of relative strength — likely a window of risk-off positioning that has since faded based on the April reading. The April chart shows that surge unwinding, which is why the 4-timeframe alignment is starting to re-form.
CHF strength is structural, not tactical. Three of the Tier 2 trades involve fading other currencies against CHF, with the only break coming in the most recent month (April). This suggests CHF’s medium- and long-term outperformance is real, but short-term mean reversion is currently in play. For longer-horizon traders, the CHF-strength trades remain attractive. For shorter-horizon traders, wait for the April underperformance to resolve before adding.
NZD has a split personality. It’s strong on longer timeframes but weak on the 3-month window. Pairs like NZD/USD and NZD/CAD can work, but expect more chop than you’d get with a Tier 1 setup like AUD/JPY.
Highest-Conviction Trades
If I had to narrow the entire 4/4 list down to a top-tier watchlist, these are the standouts:
- LONG AUD/JPY — Strongest vs. weakest currency on the entire board, confirmed at every timeframe. The single cleanest setup.
- LONG AUD/USD — Catches AUD strength against a USD that’s been notably weak in April.
- LONG CHF/JPY — A safe-haven proxy trade with strong alignment across every horizon.
- SHORT EUR/AUD — One of the cleanest “fade the weak, buy the strong” setups.
- LONG NZD/JPY — Despite NZD’s mid-pack ranking, JPY is so weak that this trade keeps printing.
Important Caveats
This analysis identifies directional bias, not entries or exits. Use it as a framework for your watchlist and your trade-direction conviction, then layer in your normal technical and fundamental confirmation:
- COT positioning extremes (especially relevant given JPY is heavily shorted by speculators — at some point that crowd unwinds)
- Key support/resistance levels
- Upcoming central bank events and macro releases
- Risk-on / risk-off market backdrop
Gold-strength confluence tells you which way the wind is blowing. Price action, structure, and timing tell you when to set the sails.
Trade safe.
— Takezo
This post is for educational and informational purposes only and does not constitute financial advice. Always do your own research and trade according to your own risk tolerance.