
War, oil, and the carry trade pressure cooker — plus where the cleanest FX setups are forming
By Takezo Trading | 02/05/2026 | Reading time: ~10 minutes
This Week’s Bottom Line
- Macro driver: Inflation persistence from a war-driven oil shock, with the Strait of Hormuz effectively closed.
- Market regime: Risk-on, but cautious. War tends to be inflationary in the long run, and that thesis is now showing up in oil and rate expectations.
- Cross-asset signal: Gold has been consolidating for several weeks, the VIX sits at 16.99, and the gold/oil ratio is at 45.12 — a reading that historically flags either expensive gold, cheap oil, or both. (Background reading: The Gold-to-Oil Ratio: A Historical and Practical Guide.)
- FX setup: A clear AUD-strong / JPY-weak axis is showing up across every timeframe I track. CHF strength is also structural on the longer horizons..
What’s Actually Driving This
The single most important fact this week is that the Strait of Hormuz is closed, and there’s no realistic path to it reopening in the near term. The fighting between the U.S. and Iran probably will continue, talks aren’t producing anything constructive, and the market is being forced to price a regime not a one-off event.
That has three immediate FX consequences:
- Oil prices are rising, and inflation expectations are repricing higher. This is the lever that flips central banks from “cutting” to “holding” or even “hiking” again.
- Japan is uniquely exposed. Japan imports nearly all of its energy, and a Hormuz closure puts direct upward pressure on import costs. That eventually forces the BoJ’s hand. If the BoJ hikes meaningfully, the global yen-funded carry trade starts to unwind — and a carry unwind is rarely orderly.
- The dollar is caught in the middle. USD acts as a safe haven and as the funding currency for global trade. Geopolitical risk is bullish DXY in spikes, but a sustained higher-rates-for-longer story across other developed markets compresses the yield differential that has supported the dollar.
Pro-risk this week: the carry trade is still alive, equities are holding up, and oil-sensitive currencies (AUD, CAD) are catching a bid.
Anti-risk this week: gold remains elevated, the VIX is creeping (16.99 is low historically but it’s been climbing off the floor), and the regional Middle East war now unambiguously involves the U.S.
Market Snapshot
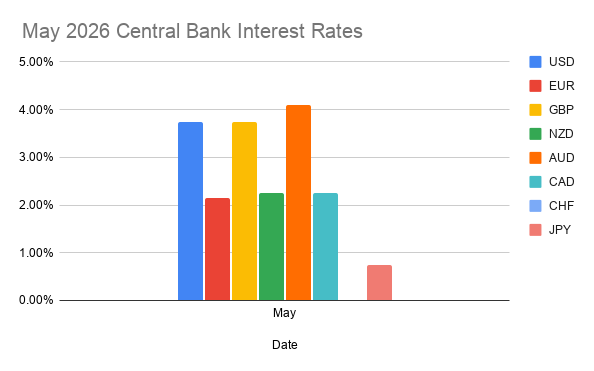
Central Bank Rates (May 2026)
| Currency | Rate |
|---|---|
| AUD | 4.10% |
| USD | 3.75% |
| GBP | 3.75% |
| NZD | 2.25% |
| CAD | 2.25% |
| EUR | 2.15% |
| JPY | 0.75% |
| CHF | 0.00% |
The yield map is the entire FX story right now. AUD sits at the top of the developed-market yield stack at 4.10%, while JPY at 0.75% and CHF at 0.00% sit at the bottom. That’s the structural reason AUD/JPY and CHF/JPY keep printing — it’s not a chart pattern, it’s a yield differential that the market keeps re-discovering.
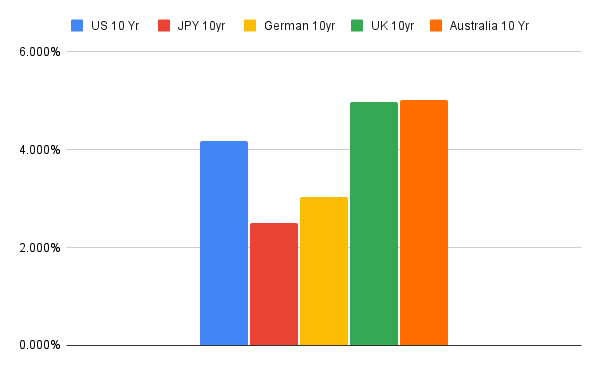
10-Year Bond Yields
| Currency | 10Y Yield |
|---|---|
| AUD | 5.015% |
| GBP | 4.973% |
| USD | 4.372% |
| EUR | 3.042% |
| JPY | 2.502% |
Long-end yields tell the same story but with one important nuance: JPY 10s at 2.502% is high by historical standards. The bond market has already started pricing the BoJ being forced to move. That’s a slow-burn pressure on every JPY-funded position out there.
Equities vs. Gold
| Index | Ratio vs Gold |
|---|---|
| DAX | 6.17 |
| FTSE 100 | 3.05 |
| CAC 40 | 2.06 |
| S&P 500 | 1.57 |
| Nikkei 225 | 0.082 |
The ratios are doing the talking. European equities are holding up best vs. gold, the S&P is middling, and the Nikkei is being absolutely crushed when measured in real (gold) terms — a reflection of yen weakness as much as anything else.
Volatility & Commodities
- VIX: 16.99
- Gold/Oil Ratio: 45.12
A 45+ gold/oil ratio historically means one of two things needs to give: either gold corrects, or oil keeps running. With Hormuz closed and central banks still net buyers of bullion, the path of least resistance is oil higher, ratio compressing toward the long-term average.
COT Snapshot — May 2nd Report
The full breakdown is in the Commitment of Traders Update – May 2nd, 2026. The headline reads:
| Currency | Specs Net | Commercials Net | % Long Ratio | Read |
|---|---|---|---|---|
| AUD | +71,869 | -97,385 | 67.79% | Largest spec long in the report |
| EUR | +35,712 | -75,137 | 54.48% | Mid-pack, but flow turned bearish this week |
| CAD | -38,473 | +37,143 | 38.78% | Specs short, but longs added / shorts covered |
| JPY | -102,059 | +99,270 | 33.81% | Largest spec short in the report |
| GBP | -60,639 | +64,120 | 33.14% | Specs leaned further short |
| NZD | -46,322 | +47,550 | 14.04% | Oversold |
| CHF | -35,221 | +42,729 | 13.26% | Oversold |
A few things stand out:
AUD and JPY are the mirror image of each other. Specs are most long the Aussie and most short the Yen — and that lines up perfectly with the gold-anchored strength rankings. When positioning and trend agree, you’re not fighting the market; you’re trading with it.
CHF and NZD positioning is stretched short. A sub-15% long ratio with commercials sitting on heavy net-long positions is the kind of setup that historically precedes a squeeze. I’m not saying chase a rip — I’m saying don’t be the one short into 13%.
The Yen short is now over 100,000 contracts net short. That’s the largest spec position in the entire report. The trade has been right for a long time, and it can stay right longer. But the BoJ-forced-to-hike scenario is exactly the catalyst that unwinds a position this large.
Gold-Anchored Confluence: Where The Trades Actually Are
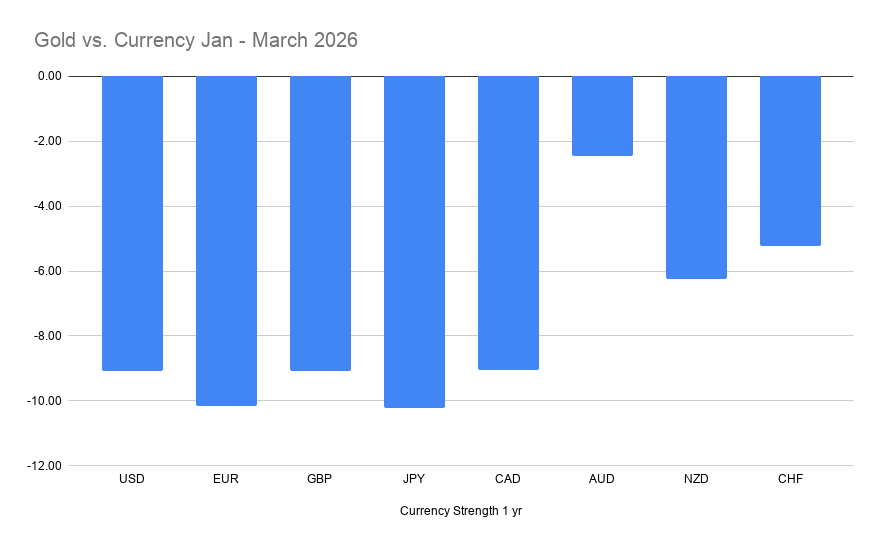
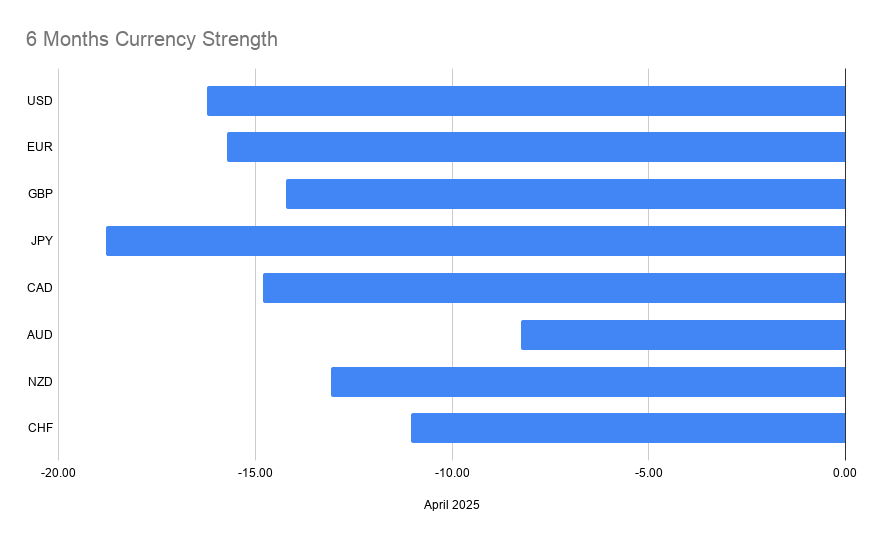
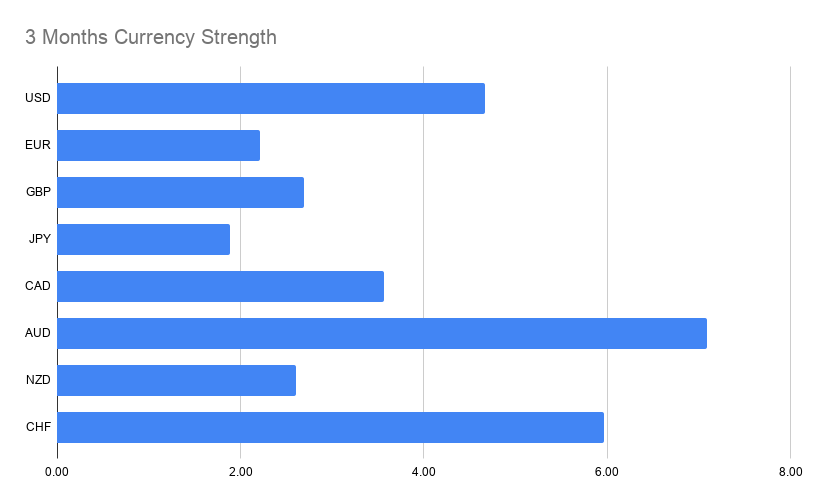
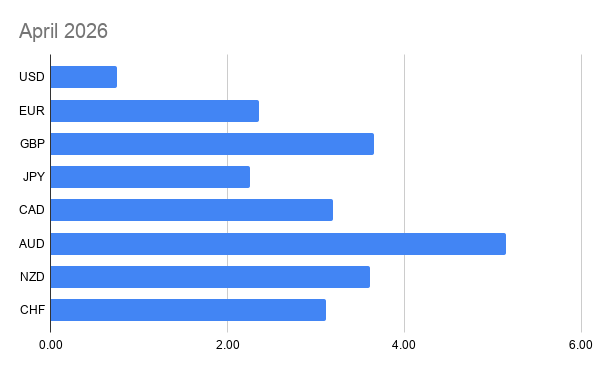
The short version: I rank every major currency by performance against gold across four timeframes — April 2026, 3-month, 6-month, and YTD — and look for currencies that are consistently strong or consistently weak across all of them.
The rankings produce two extremes:
- AUD is the strongest currency in every single timeframe.
- JPY is the weakest currency in every single timeframe.
- CHF is consistently #2 across the longer horizons.
That sets up a board where the highest-conviction trade is the AUD/JPY axis, with CHF strength as a secondary theme.
Tier 1 — Full Confluence (4 of 4 Timeframes)
These are the cleanest setups on the board. Same directional bias across every horizon I look at.
AUD-Strength Plays
| Pair | Direction | Logic |
|---|---|---|
| AUD/JPY | LONG | Strongest vs. weakest — the cleanest setup on the board |
| AUD/USD | LONG | AUD outperforming USD across every horizon |
| AUD/CAD | LONG | Sustained AUD outperformance vs. CAD |
| AUD/NZD | LONG | AUD beating NZD even at the short timeframe |
| AUD/CHF | LONG | AUD edges ahead of CHF in every window |
| EUR/AUD | SHORT | EUR persistently weaker than AUD |
| GBP/AUD | SHORT | GBP can’t keep up with AUD |
JPY-Weakness Plays
| Pair | Direction | Logic |
|---|---|---|
| CHF/JPY | LONG | CHF dominates JPY across all timeframes |
| NZD/JPY | LONG | NZD outperforms JPY despite Kiwi softness elsewhere |
| GBP/JPY | LONG | GBP firmly stronger than JPY |
| CAD/JPY | LONG | CAD ahead of JPY at every horizon |
| EUR/JPY | LONG | EUR clears JPY in every window |
| USD/JPY | LONG | USD outperforms JPY in every timeframe |
CHF-Strength Plays (outside the AUD/JPY axis)
| Pair | Direction | Logic |
|---|---|---|
| EUR/CHF | SHORT | CHF stronger than EUR in every timeframe |
| USD/CHF | SHORT | CHF outperforming USD across the board |
Tier 1 total: 15 trades.
Tier 2 — Strong Confluence (3 of 4 Timeframes)
These pairs aligned in three of the four timeframes. The “broken” timeframe is noted because it tells you where the trend wobbled — useful context for entry timing and risk.
| Pair | Direction | Where It Aligns | Where It Broke |
|---|---|---|---|
| NZD/CHF | SHORT | 3M, 6M, YTD | NZD edged CHF in April |
| GBP/CHF | SHORT | 3M, 6M, YTD | GBP edged CHF in April |
| CAD/CHF | SHORT | 3M, 6M, YTD | Tied in April |
| NZD/USD | LONG | April, 6M, YTD | USD beat NZD in 3M |
| EUR/NZD | SHORT | April, 6M, YTD | Tied in 3M |
| NZD/CAD | LONG | April, 6M, YTD | CAD beat NZD in 3M |
| EUR/GBP | SHORT | April, 6M, YTD | Tied in 3M |
| GBP/CAD | LONG | April, 6M, YTD | CAD beat GBP in 3M |
| EUR/CAD | SHORT | April, 3M, YTD | Tied in 6M |
Tier 2 total: 9 trades.
What the 3/4 Pattern Tells Us
The 3-month window is doing most of the breaking. Five of the nine Tier 2 trades are interrupted specifically at the 3-month timeframe — a stretch where USD and CAD had a brief surge of relative strength, likely a window of risk-off positioning that has since faded. The April reading shows that surge unwinding, which is why the 4-timeframe alignment is starting to re-form across the board.
CHF strength is structural, not tactical. Three of the Tier 2 trades involve fading other currencies against CHF, with the only break in the most recent month. CHF’s medium- and long-term outperformance is real, but short-term mean reversion is currently in play. Longer-horizon traders can stay with CHF strength; shorter-horizon traders should wait for the April underperformance to resolve.
NZD has a split personality. Strong on longer timeframes, weak on the 3-month window. Pairs like NZD/USD and NZD/CAD can work, but expect more chop than you’d get with a Tier 1 setup like AUD/JPY.
The Highest-Conviction Watchlist
If I had to narrow the 24-trade board down to the five names I’d want on the screen this week, these are them:
- LONG AUD/JPY — Strongest currency vs. weakest currency, confirmed at every timeframe. The single cleanest setup on the entire board. Backed by the yield differential (4.10% vs 0.75%), spec positioning, and the gold-anchored ranking.
- LONG AUD/USD — Catches AUD strength against a USD that’s been notably weak in April. The April flip on USD ranking is what’s letting this trade firm up again.
- LONG CHF/JPY — A safe-haven proxy trade with strong alignment across every horizon. If risk-off accelerates because of the war, this is the cleanest expression.
- SHORT EUR/AUD — One of the cleanest “fade the weak, buy the strong” setups, backed by the relative yield gap and the persistent EUR underperformance vs. AUD.
- LONG NZD/JPY — Despite NZD’s mid-pack ranking, JPY is so weak that this trade keeps printing. The NZD short positioning (14.04% long ratio) adds a contrarian kicker.
Caveats Before You Click The Mouse
This analysis identifies directional bias, not entries or exits. Use it as a framework for your watchlist and your conviction. Then layer in your normal confirmation:
- COT positioning extremes. JPY is heavily shorted by specs — at some point that crowd unwinds. Stay aware of the catalyst risk.
- Key support / resistance. Gold-anchored rankings tell you the direction, not the level.
- Central bank events. Any signal from the BoJ that they’re moving is a fast-flip moment for everything in the JPY column.
Gold-strength confluence tells you which way the wind is blowing. Price action, structure, and timing tell you when to set the sails.
Weekly Playbook
- Primary macro driver to watch: Oil. As long as Hormuz stays closed, every other macro print is downstream of the energy shock.
- Best FX expressions: AUD-long and JPY-short, with CHF-long as the safe-haven complement. AUD/JPY remains the headline trade.
- What flips the view: A genuine de-escalation in the Middle East — Hormuz reopening or a clear declaration of the end to the conflict would compress the inflation premium, pull oil lower, and take the urgency out of the BoJ-hike thesis. That’s the cleanest reversal trigger.
- Key event-risk days: Any U.S. CPI / PCE print, any BoJ communication, and the next OPEC+ headline cycle.
See you next week.
— Takezo
Data Source: Commodity Futures Trading Commission (CFTC), spot FX, and gold-anchored relative-strength analysis.
Disclaimer: This content is for educational and informational purposes only and does not constitute financial or investment advice. Always do your own research and trade according to your own risk tolerance.