Navigating the Bond Market: Monthly Insights into US Bond Yields (March 2025)
Welcome to our new monthly series at Takezo Trading, where we explore the crucial bond market through the lens of US Government bond yields. Each month, we’ll break down the latest yield trends and explain their implications for currency trading and investing. Today, let’s dive into the data through March 2025.
March 2025 Update: What the Charts Say
US 10-Year vs. US 30-Year Bonds (2010-2025)
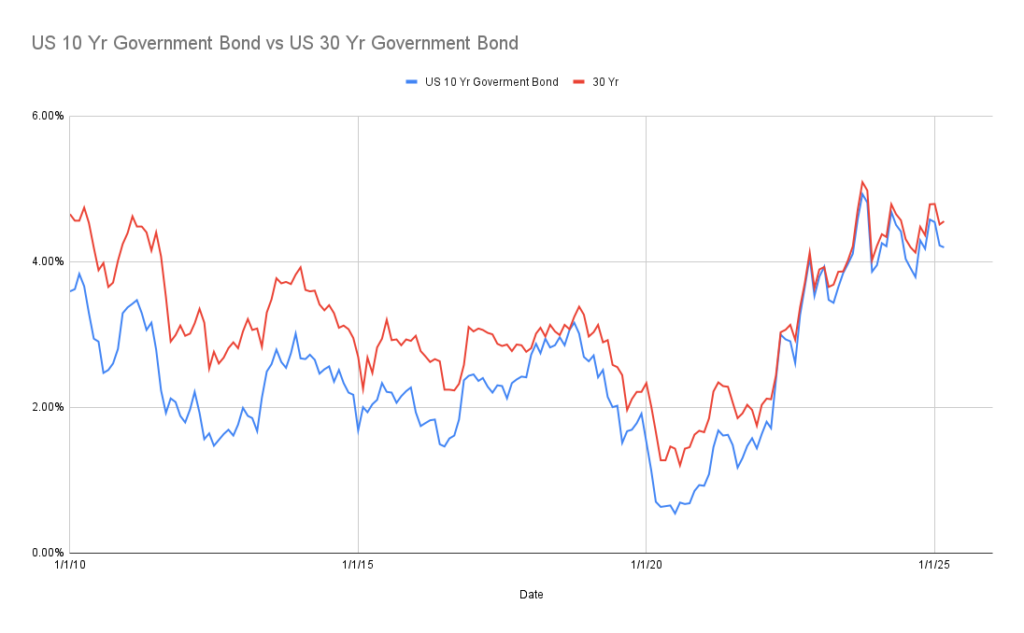
Over the past 15 years, we’ve consistently observed that the 10-year and 30-year bond yields typically move in tandem, reflecting broad investor sentiment on economic health and inflation expectations.
This month, the spread remains narrow, suggesting ongoing economic uncertainty or inflation concerns. Tight spreads or inversions (where the 10-year yield approaches or surpasses the 30-year yield) usually signal short-term economic pressures, which are essential for currency traders to monitor. A tighter spread often implies a stronger USD as investors seek safety in short-term yields.
US 2-Year vs. US 10-Year Bonds (2010-2025)
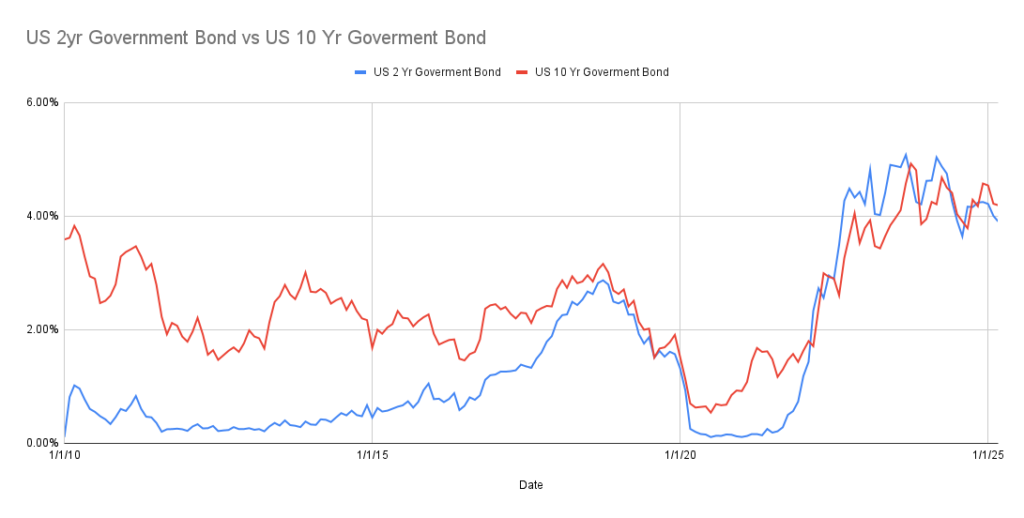
This chart remains critical for understanding monetary policy sentiment. The sharp rise in the 2-year yield we’ve observed indicates continued aggressive monetary tightening from the Federal Reserve. Such tightening generally leads to a stronger dollar, attracting investors seeking higher yields. The recent surge in the 2-year yield above the 10-year yield continues to signal aggressive monetary tightening by the Federal Reserve, aiming to curb inflation.
This yield curve inversion—a strong historical predictor of economic slowdowns or recessions—suggests markets remain cautious. Currency traders should note that sustained inversions can lead to volatility and a stronger USD as investors flock to higher-yielding, shorter-term investments
March 2025 Yield Curve Snapshot
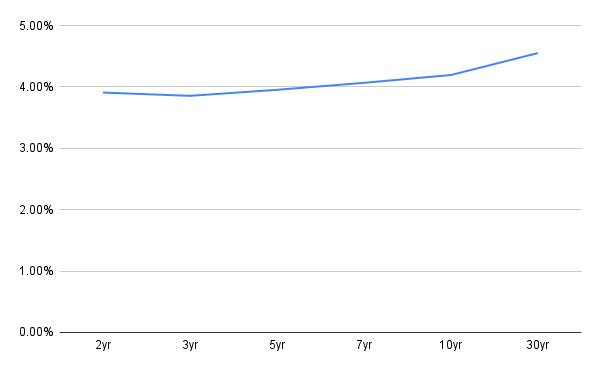
This chart shows the yield curve as of March 2025. The curve demonstrates an upward slope from shorter-term (2-year) to longer-term (30-year) yields, although it remains relatively flat initially. A flatter curve signals caution about short-term economic growth and potential market volatility, while a steeper long-end suggests some confidence in long-term economic stability.
Why Monthly Monitoring Matters for Traders
Consistent monitoring of these yield patterns is invaluable for currency traders and investors:
- Interest Rate Clarity: Monthly updates provide clarity on Fed policy direction, essential for predicting currency strength.
- Risk Management: Yield trends help identify periods of market stress or investor caution, guiding risk-on or risk-off trading strategies.
- Early Warning Signals: Yield curve inversions or unusual spreads offer early warnings of economic shifts, giving traders a competitive advantage.
March Key Takeaways:
- Continue to expect strong USD performance if short-term yields remain elevated.
- Watch closely for signs of economic slowdown due to sustained yield curve inversion.
- Leverage monthly insights to stay ahead of shifts in investor sentiment and central bank policies.
Each month, I will update these charts and analyze what the latest bond market movements mean for you. As Miyamoto Musashi advises, “The important thing in strategy is to suppress the enemy’s useful actions but allow his useless actions.” By regularly interpreting bond yields, you’ll strategically navigate currency markets to your advantage.
Stay tuned for next month’s update!