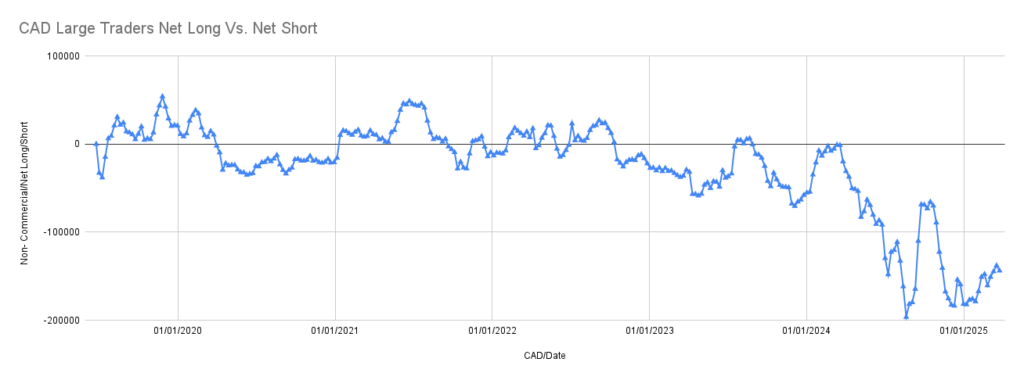
CAD Large Traders Net Long vs. Net Short
Y-Axis: Net Position (Long – Short)
X-Axis: Timeline from June 2019 to March 25, 2025
- From 2019 to early 2021, speculators held modest net longs.
- Throughout 2022–2023, positions hovered near neutral, before collapsing into deep net shorts in 2024, reaching lows near -150,000 contracts.
- As of March 25, 2025, net shorts remain significant, though a slight recovery is visible.
Insight: Sentiment is extremely bearish, possibly overstretched.
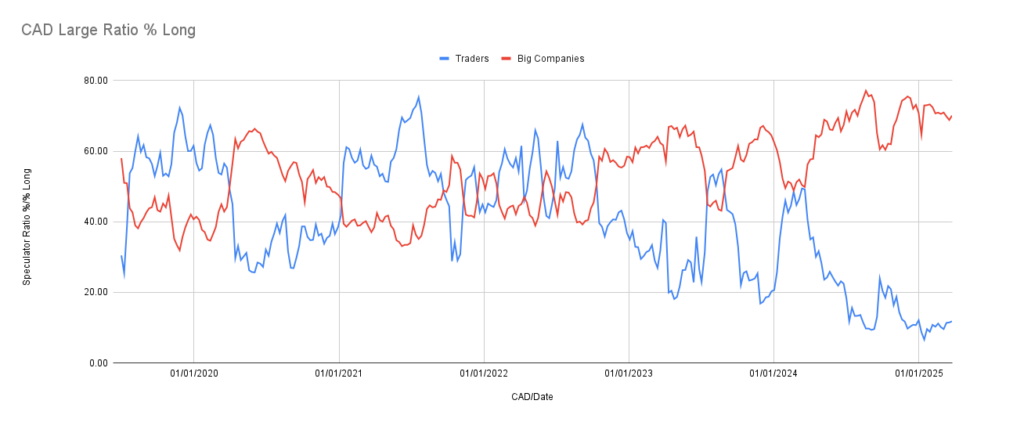
CAD Large Ratio % Long
Y-Axis: Speculator Ratio % Long
X-Axis: Timeline from June 2019 to March 25, 2025
- Speculator long ratios have steadily declined since 2021, holding below 30% into 2025.
- Commercials are strongly long, maintaining ratios above 70% through late 2024 and into 2025.
Insight: A strong divergence—commercials are buying while speculators are heavily short.
Strategic Takeaway:
As of March 25, 2025, CAD positioning shows classic contrarian potential. Extreme bearish sentiment combined with commercial accumulation points to a possible reversal. Look for confirmation via fundamentals or price action.
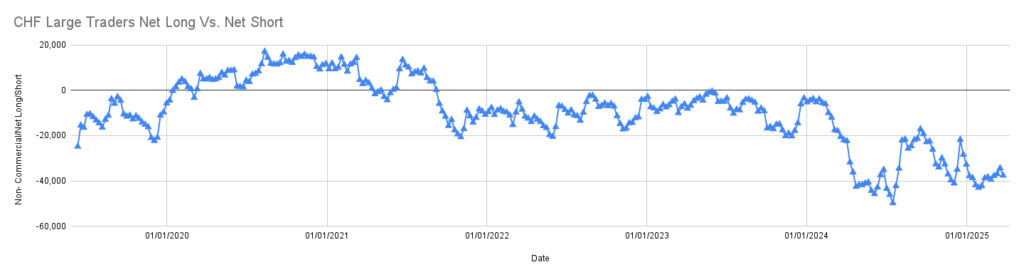
CHF Large Traders Net Long vs. Net Short
Y-Axis: Net Position (Long – Short)
X-Axis: Timeline from June 2019 to March 25, 2025
- From 2019 to early 2021, speculators steadily built net long positions, peaking just under +20,000 contracts.
- From mid-2021 onward, net positioning declined and turned consistently negative.
- As of March 2025, speculators remain net short, holding around -40,000 contracts.
Insight: Bearish sentiment has persisted since 2022, with no strong reversal signs yet.
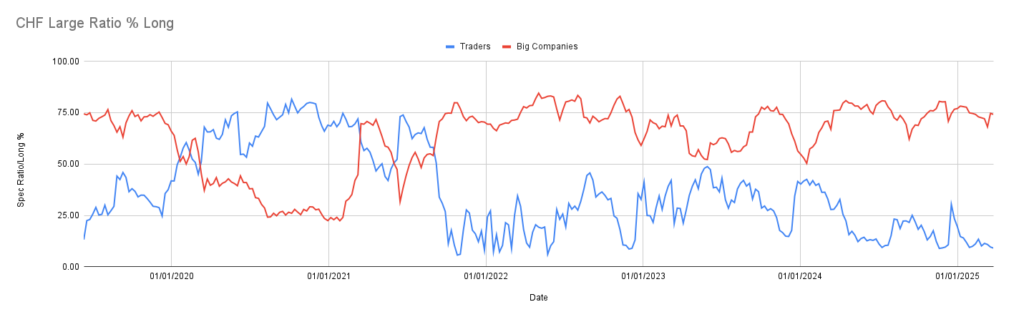
CHF Large Ratio % Long
Y-Axis: Speculator Ratio % Long
X-Axis: Timeline from June 2019 to March 25, 2025
- Speculator long ratios surged above 70% in 2020–2021 but sharply declined from 2022, staying below 30% through 2025.
- Commercials increased long exposure inversely, consistently holding above 70% in recent years.
Insight: Strong divergence—speculators are heavily short while commercials maintain a long bias, suggesting a possible contrarian setup.
Strategic Takeaway:
As of March 25, 2025, CHF shows prolonged speculative bearishness against steady commercial optimism. This imbalance could point to a potential reversal opportunity, especially if supported by economic or technical triggers.
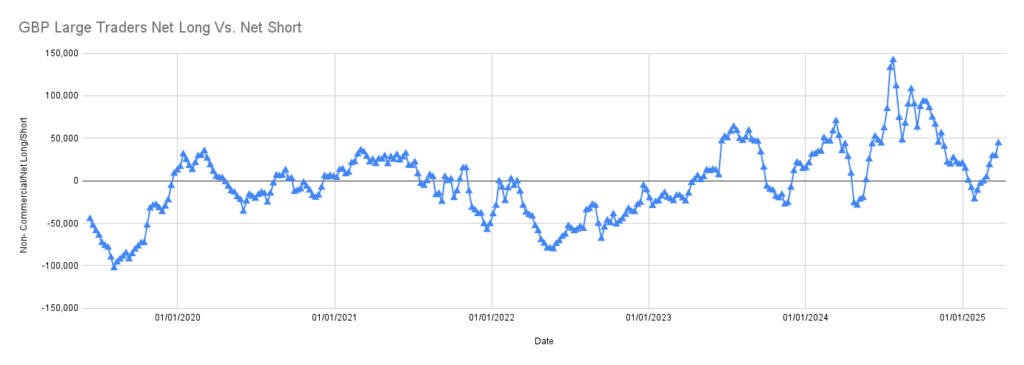
GBP Large Traders Net Long vs. Net Short
Y-Axis: Net Position (Long – Short)
X-Axis: Timeline from June 2019 to March 25, 2025
- Speculators were net short through most of 2019, then turned long in 2020.
- From 2021 to 2023, positioning fluctuated, reflecting mixed sentiment.
- In 2024, sentiment surged—net longs peaked near +140,000 contracts.
- As of March 2025, net positioning has pulled back but remains moderately bullish.
Insight: While off the highs, traders still favor GBP on balance.
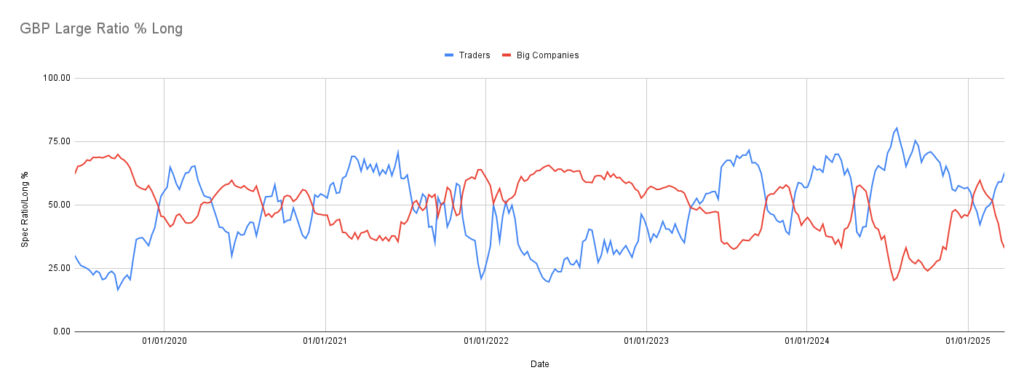
GBP Large Ratio % Long
Y-Axis: Speculator Ratio % Long
X-Axis: Timeline from June 2019 to March 25, 2025
- Speculator long ratios rose from below 30% in 2019 to 60–70% in bullish phases (2020, 2024).
- Commercials generally took the opposite stance, adding long exposure when speculators pulled back.
- Recent readings show speculators remain above 50%, while commercials are fading.
Insight: A cooling of bullish sentiment is underway; commercials are stepping back in.
Strategic Takeaway:
As of March 25, 2025, GBP remains in bullish territory, but the pullback in net longs and rising commercial interest may hint at short-term consolidation or a corrective phase. Watch for support levels or macro catalysts to determine if the trend resumes or stalls.
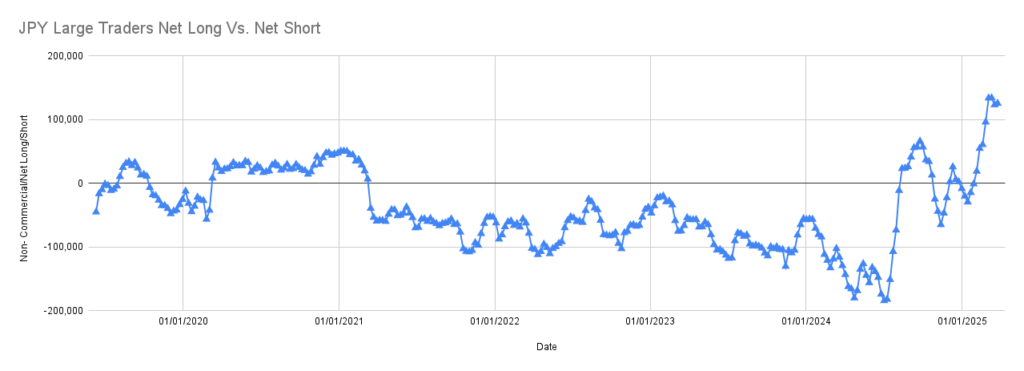
JPY Large Traders Net Long vs. Net Short
Y-Axis: Net Position (Long – Short)
X-Axis: Timeline from June 2019 to March 25, 2025
- Speculators fluctuated between modest longs and shorts until late 2021.
- From 2022 to late 2023, net positioning stayed deeply negative.
- In late 2024, sentiment reversed sharply, with speculators swinging from extreme net shorts to net longs above +100,000 contracts by March 2025.
Insight: A dramatic sentiment reversal—speculators are now heavily long after years of bearishness.
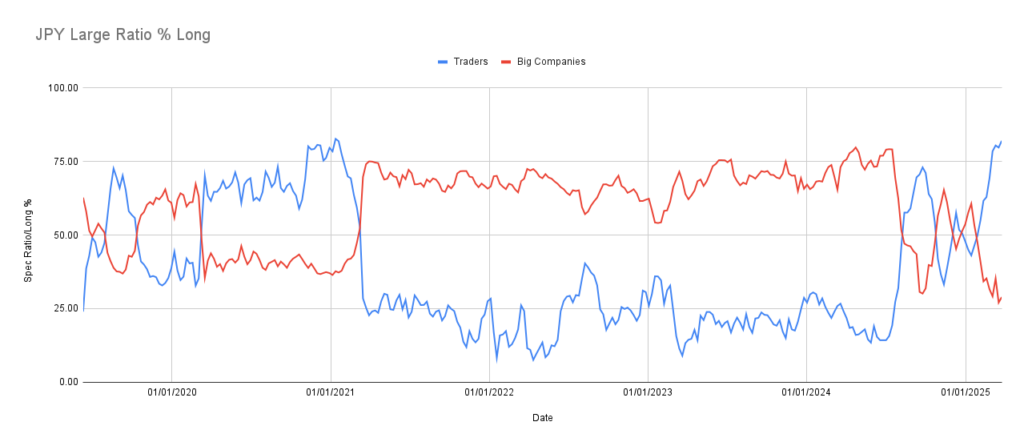
JPY Large Ratio % Long
Y-Axis: Speculator Ratio % Long
X-Axis: Timeline from June 2019 to March 25, 2025
- Speculator long ratios stayed high through 2020 but collapsed in 2021, holding below 30% until late 2024.
- A sharp rally in long ratios began in late 2024, pushing above 75% by early 2025.
- Commercials did the opposite—reducing their long ratios as speculators turned aggressively bullish.
Insight: With commercials fading and speculators at extreme bullish levels, this could be nearing a sentiment peak.
Strategic Takeaway:
As of March 25, 2025, speculative sentiment on JPY has flipped from bearish to strongly bullish, with potential for exhaustion. Traders should be cautious of chasing the move and watch for any technical or fundamental signs of reversal.
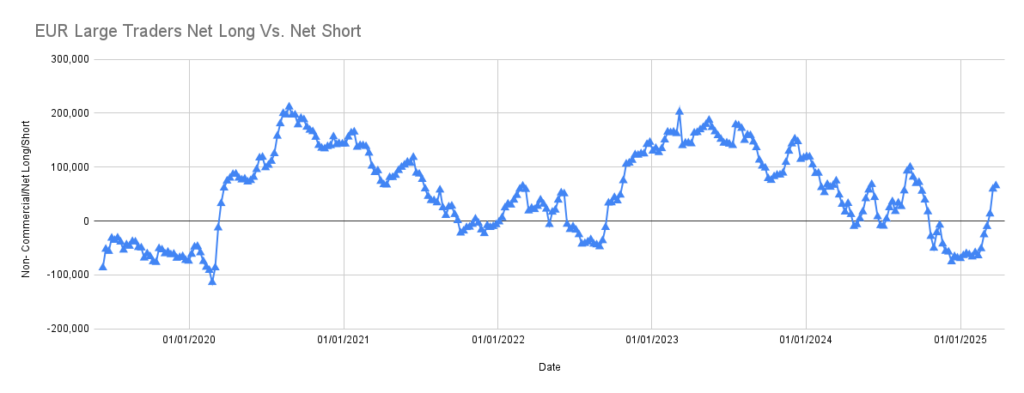
EUR Large Traders Net Long vs. Net Short
Y-Axis: Net Position (Long – Short)
X-Axis: Timeline from June 2019 to March 25, 2025
- Speculators held net short positions through 2019, then flipped strongly long in 2020, peaking near +220,000 contracts.
- From 2021 to 2023, sentiment remained bullish but gradually declined.
- Net longs dipped near zero by late 2024, with a slight recovery seen in early 2025.
Insight: After years of strong bullishness, sentiment has cooled, though positioning remains moderately positive.
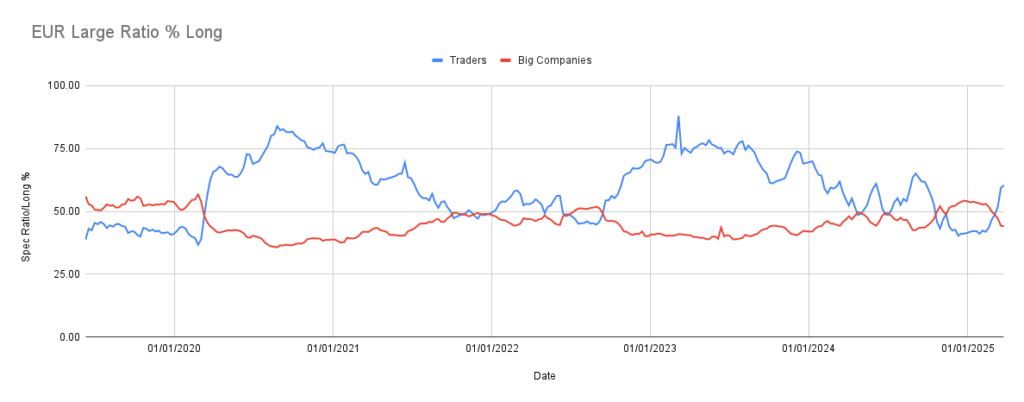
EUR Large Ratio % Long
Y-Axis: Speculator Ratio % Long
X-Axis: Timeline from June 2019 to March 25, 2025
- Speculator long ratios surged in 2020, staying above 70% during peak bullish phases.
- Ratios dropped to near 50% in late 2021–2022 and remained mixed into 2024.
- Commercials followed the opposite trend—buying into weakness when speculator confidence faded.
Insight: Long ratio compression suggests fading bullish conviction; commercial accumulation hints at potential support.
Strategic Takeaway:
As of March 25, 2025, EUR sentiment is off the highs but still bullish. The pullback in positioning and long ratios may signal consolidation, but steady commercial interest suggests downside could be limited. Watch for momentum shifts or macro cues to confirm the next move.
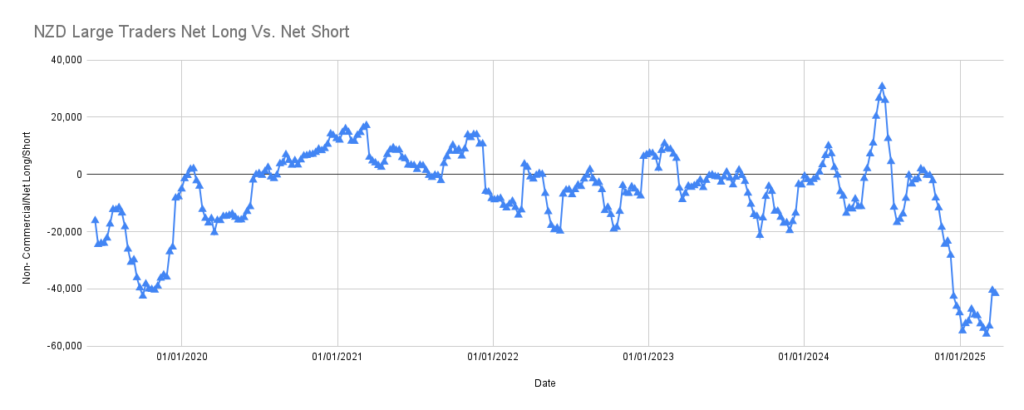
NZD Large Traders Net Long vs. Net Short
Y-Axis: Net Position (Long – Short)
X-Axis: Timeline from June 2019 to March 25, 2025
- Speculators were deeply net short in 2019, then shifted to net long through 2021.
- From 2022 to late 2024, positioning fluctuated near neutral, reflecting uncertainty.
- In early 2025, net shorts spiked again, reaching lows near -60,000 contracts.
Insight: Recent sentiment is strongly bearish, matching levels seen in 2019.
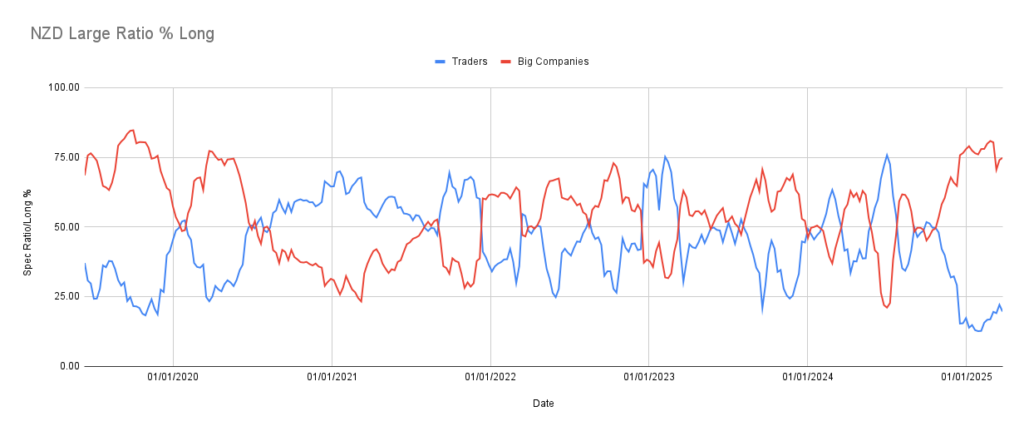
NZD Large Ratio % Long
Y-Axis: Speculator Ratio % Long
X-Axis: Timeline from June 2019 to March 25, 2025
- Long ratios climbed through 2020–2021, holding above 50%, then declined with choppy behavior into 2023–2024.
- By early 2025, speculator long ratios dropped below 25%, while commercials moved in the opposite direction, reaching 75%+.
Insight: Strong divergence—commercials are long while speculators are heavily short.
Strategic Takeaway:
As of March 25, 2025, NZD sentiment is at a bearish extreme, with speculators crowded short and commercials accumulating. This setup suggests a potential bottoming scenario—watch for confirmation through technical signals or macro shifts.
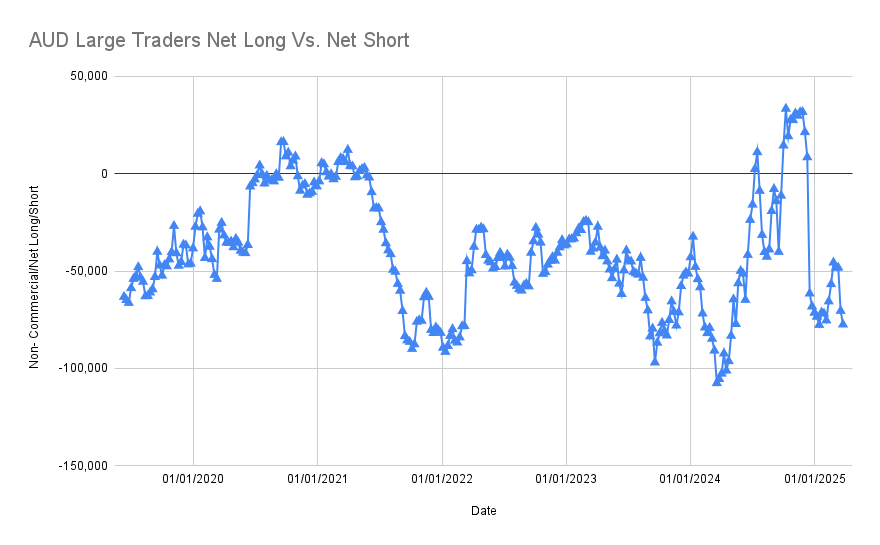
AUD Large Traders Net Long vs. Net Short
Y-Axis: Net Position (Long – Short)
X-Axis: Timeline from June 2019 to March 25, 2025
- From 2019 to early 2021, net short positioning gradually eased into neutrality.
- Throughout 2022 and 2023, speculators remained consistently net short.
- In late 2024, a spike in long positions occurred, followed by a quick pullback into early 2025.
Insight: Traders attempted a bullish reversal in late 2024, but sentiment has since softened again.
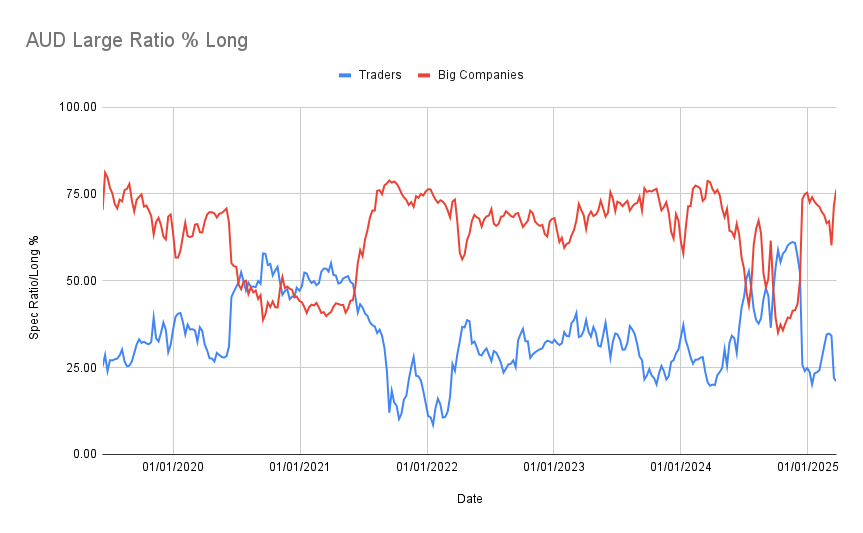
AUD Large Ratio % Long
Y-Axis: Speculator Ratio % Long
X-Axis: Timeline from June 2019 to March 25, 2025
- Speculator long ratios declined from near 50% in 2021 to around 20–30% through 2023–2024.
- A brief spike in late 2024 pushed the long ratio above 60%, before falling back under 30%.
- Commercials maintained high long ratios throughout, mostly above 70%.
Insight: Commercials are consistently long while speculators show weak and erratic bullish conviction.
Strategic Takeaway:
As of March 25, 2025, AUD sentiment remains fragile, with speculators retreating from recent bullish attempts. However, persistent commercial long exposure suggests underlying support—a setup worth monitoring for a second attempt higher.
Source: Commodity Futures Trading Commission (CFTC), Commitments of Traders (COT) data. Available at: https://www.cftc.gov/MarketReports/CommitmentsofTraders/index.htmhttps://www.cftc.gov/MarketReports/CommitmentsofTraders/index.htm