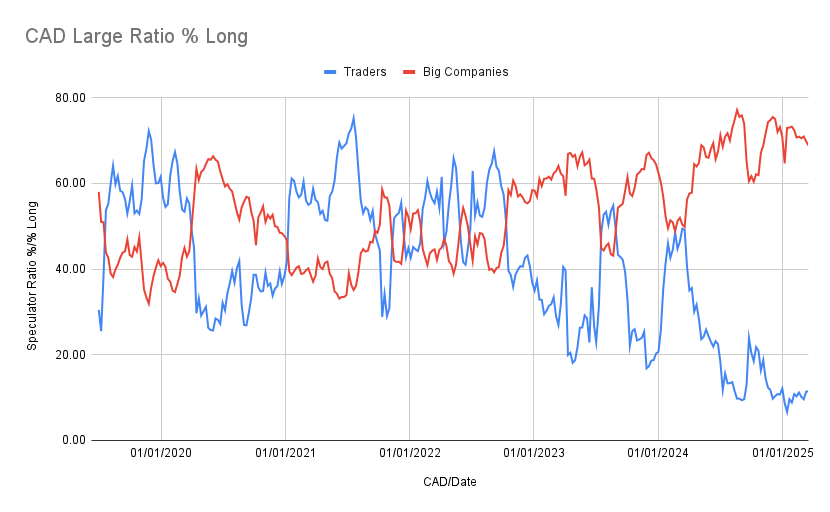
CAD Large Ratio % Long
Title: CAD Large Ratio % Long
Legend:
- Blue (Traders): Speculative traders (non-commercials)
- Red (Big Companies): Commercial traders (hedgers)
Interpretation:
- Speculative traders (blue line) have steadily reduced their long exposure since mid-2023, dropping from around 60% down to below 20% in early 2025.
- Commercial traders (red line) are showing the opposite behavior, increasing their long exposure over the same period, now holding around 70% long positions.
Insights:
- Speculators and commercials tend to take opposing positions—which is exactly what we see here.
- The divergence (one going short, the other long) is significant. Commercials are often considered the “smart money” because they are hedging based on real-world economic needs.
- When speculators are heavily short while commercials are long, it may suggest the CAD is near a bottom and poised for a potential reversal upward.
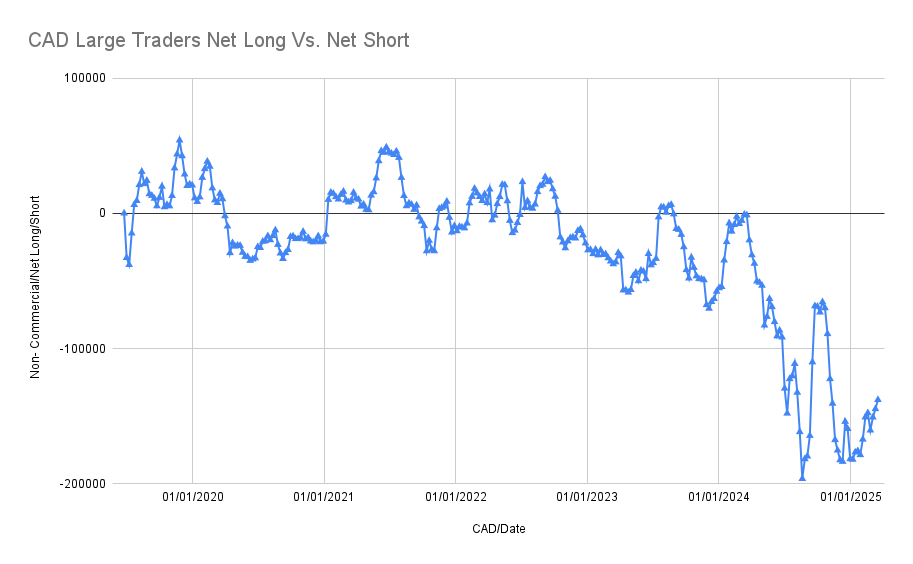
CAD Large Traders Net Long Vs. Net Short
Title: CAD Large Traders Net Long Vs. Net Short
Y-Axis: Net Position (Long minus Short)
X-Axis: Timeline from November 2019 to March 18th 2025
Interpretation:
- From 2019 to mid-2022, the net positions mostly fluctuated around the zero line—indicating indecision or a balanced market.
- Starting in 2023, there’s a clear, deepening move into net short territory.
- By late 2024, net short positions peaked around -180,000 contracts, a massive bearish stance by large traders.
Insights:
- The sharp and sustained increase in net short positioning by large speculators confirms strong bearish sentiment on CAD.
- However, if this extreme bearishness coincides with commercials becoming heavily long (as seen in the left Graph), it could indicate a contrarian buy signal.
- Historically, such extremes in sentiment are unsustainable and often followed by significant price reversals.
Conclusion:
The data suggests we are reaching an extreme in sentiment. Speculators are piling into short positions while commercials are loading up on longs. Historically, this type of setup often leads to a bullish reversal in the Canadian Dollar. While it’s risky to time reversals, this could be a time to scale out of shorts or look for confirmation to go long, especially if fundamentals (e.g. oil prices, Canadian economic data) start aligning.
CHF Large Traders Net Long vs. Net Short
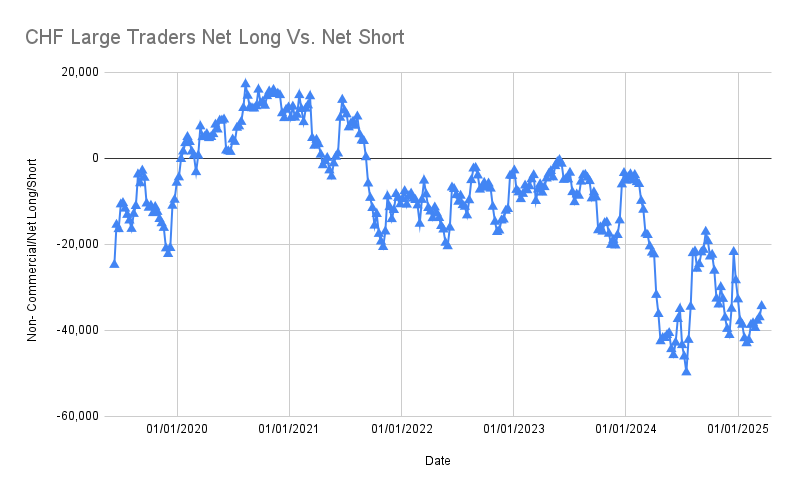
Title: CHF Large Traders Net Long vs. Net Short
Y-Axis: Net Position (Long – Short)
X-Axis: Timeline from 2019 to March 18th 2025
Interpretation:
- From 2019 through early 2021, there was a steady climb from net short to a substantial net long position, peaking around +15,000 contracts.
- From mid-2021 onward, sentiment reversed. Large traders began reducing long positions, and by 2022-2023, net positions oscillated around zero.
- Throughout 2024 and into early 2025, speculators were consistently net short, with positioning falling as low as -50,000 contracts.
Insight:
The data shows a clear shift in sentiment over time. Speculators have steadily grown more bearish on CHF since mid-2021. The persistent net short positioning into 2025 suggests a strong downward bias, though this also presents a potential contrarian setup if paired with opposing commercial behavior or improving fundamentals.
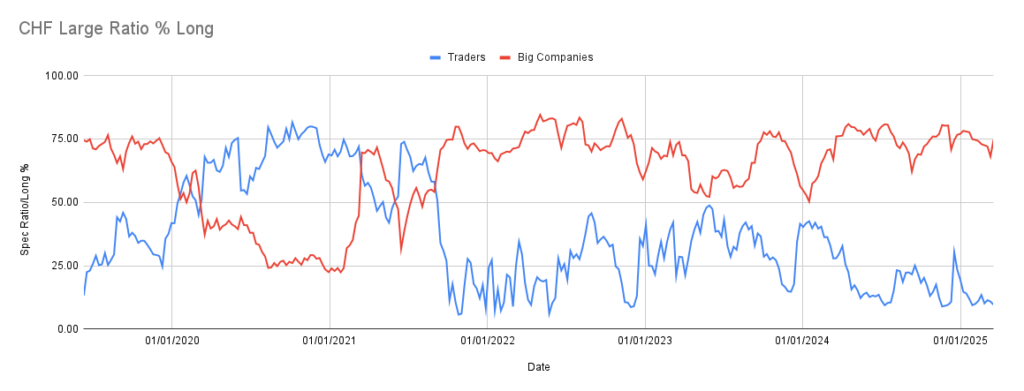
CHF Large Ratio % Long
Title: CHF Large Ratio % Long
Legend:
- Blue (Traders): Speculators (non-commercial)
- Red (Big Companies): Commercials (hedgers)
Interpretation:
- Between 2019 and mid-2021, speculator long ratios rose significantly, surpassing 75%—indicating strong bullish sentiment.
- From 2022 through early 2025, the ratio consistently dropped, often staying below 30%. This confirms the declining net positions seen in Graph 1.
- Commercials moved in the opposite direction. As speculators pulled back, commercials began increasing their long ratios, maintaining levels above 60% through most of 2022–2025.
Insight:
This divergence is significant. When speculators are highly bearish and commercials are heavily long, it may suggest that CHF is undervalued or near a price base. Commercials are often more aligned with macroeconomic fundamentals and may be positioning in anticipation of a reversal or stabilization.
Strategic Takeaways:
- The persistent net short exposure and low long ratios from speculators reflect a strong bearish consensus on CHF.
- Commercials holding consistently high long ratios suggest a more favorable view of the currency, often associated with real-world hedging needs or valuation expectations.
- This setup could represent a contrarian opportunity: if market conditions improve or USD weakens, CHF may see a strong rebound.
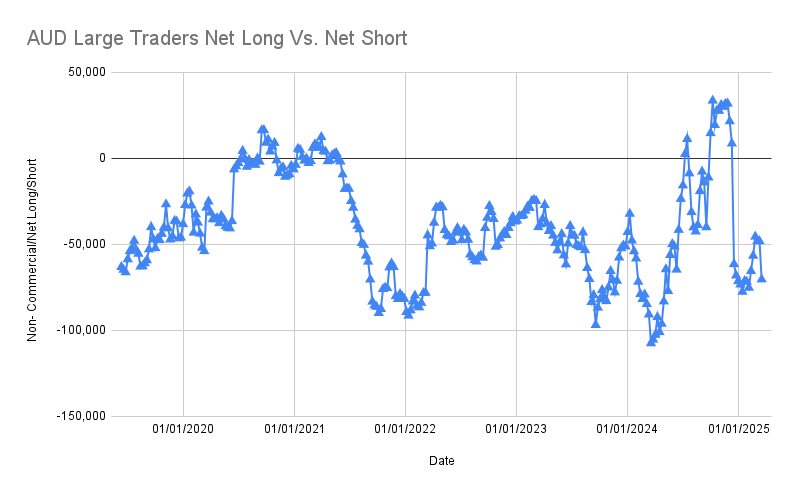
AUD Large Traders Net Long vs. Net Short
Title: AUD Large Traders Net Long vs. Net Short
Y-Axis: Net Position (Long – Short)
X-Axis: Timeline from 2019 to March 18th 2025
Interpretation:
- From 2019 to late 2020, large traders were net short, holding positions near -50,000 to -75,000 contracts.
- A brief shift into net long territory occurred between late 2020 and mid-2021, peaking just above 0.
- From late 2021 onward, speculators resumed building net short positions, with some extreme dips approaching -125,000 in 2024.
- Notably, there were a few sharp reversals back toward net long near the end of 2024, but those did not hold.
Insight:
Speculators have shown a sustained bearish view on AUD over the long term, particularly since 2021. Even when net long positioning has briefly returned, it has quickly reversed, indicating that any bullish sentiment was short-lived. The recent return to net short territory in 2025 suggests lingering caution among speculators.
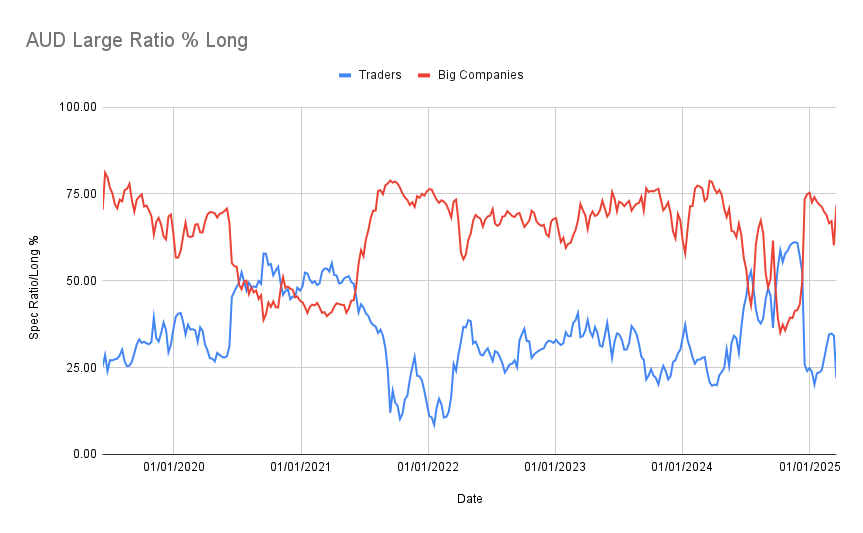
AUD Large Ratio % Long
Title: AUD Large Ratio % Long
Legend:
- Blue (Traders): Speculators (non-commercial)
- Red (Big Companies): Commercial traders (hedgers)
Interpretation:
- From 2019 to 2021, speculator long ratios slowly climbed from around 25% to 50%, signaling a moderate increase in bullish sentiment.
- In 2022 and 2023, speculator long ratios mostly stayed below 40%, often dipping below 20% during peak bearish phases.
- Conversely, commercial traders maintained high long ratios—above 70%—through most of this same period.
- In late 2024 and early 2025, speculator long ratios briefly surged above 50% but quickly fell again, aligning with the net short reversal seen in Graph 1.
Insight:
The pattern shows a clear divergence between speculators and commercials over the past few years. Commercials have consistently been long AUD while speculators have remained bearish. This divergence may signal that speculators are misaligned with the real-world valuation or economic outlook—especially if commercial demand reflects confidence in Australia’s trade or commodity-based fundamentals.
Strategic Takeaways:
- Speculative traders have mostly held a bearish stance on AUD since 2021, punctuated by occasional but unsustained bullish attempts.
- Commercials, however, have remained confidently long over the same period, suggesting a disconnect in sentiment between short-term speculators and long-term hedgers.
- Such consistent divergence between commercials (long) and speculators (short) often precedes price stabilization or bullish reversals—particularly if supported by external catalysts like rising commodity prices or shifts in global risk sentiment.
For traders, this setup warrants close monitoring: while sentiment remains weak among specs, any shift in macroeconomic conditions or breakout in price action could signal a solid long opportunity in AUD.
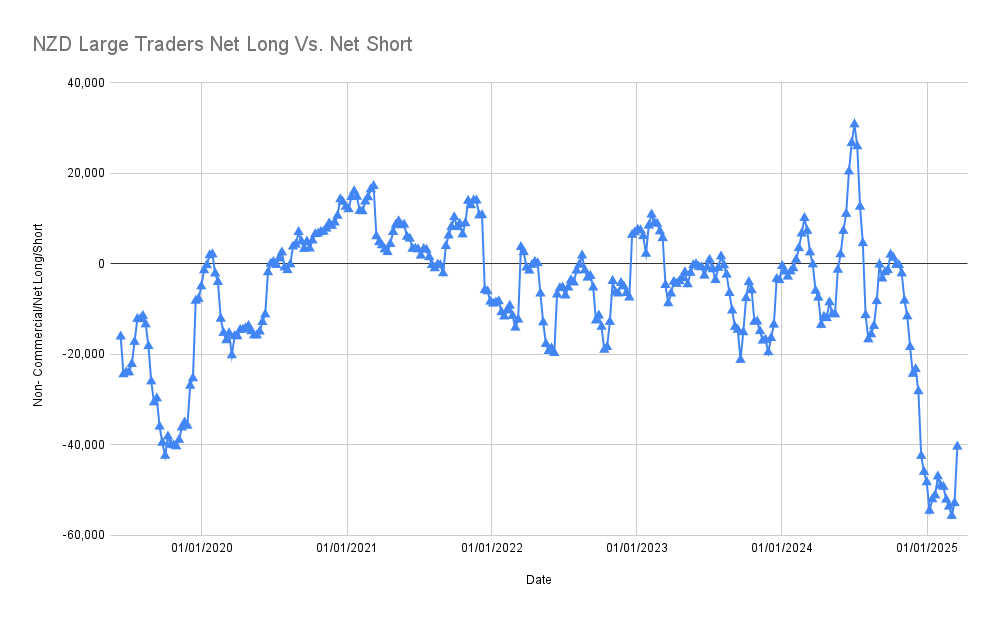
NZD Large Traders Net Long vs. Net Short
Title: NZD Large Traders Net Long vs. Net Short
Y-Axis: Net Position (Long – Short)
X-Axis: Timeline from 2019 to March 18th 2025
Interpretation:
- Net positions were strongly negative in 2019, bottoming around -40,000 contracts.
- Through 2020 and 2021, speculators steadily built net long positions, peaking near +20,000 contracts in early 2021.
- From 2022 to 2023, net positions hovered near zero, indicating indecision or balanced sentiment.
- In late 2024 and early 2025, speculators sharply increased short exposure, dropping as low as -60,000 contracts—an extreme bearish position.
Insight:
This dramatic shift from balanced to heavily short sentiment suggests a rapid loss of confidence in the NZD. The recent extreme net short positioning might reflect oversold sentiment, especially if it isn’t supported by a similar shift in commercial positions.
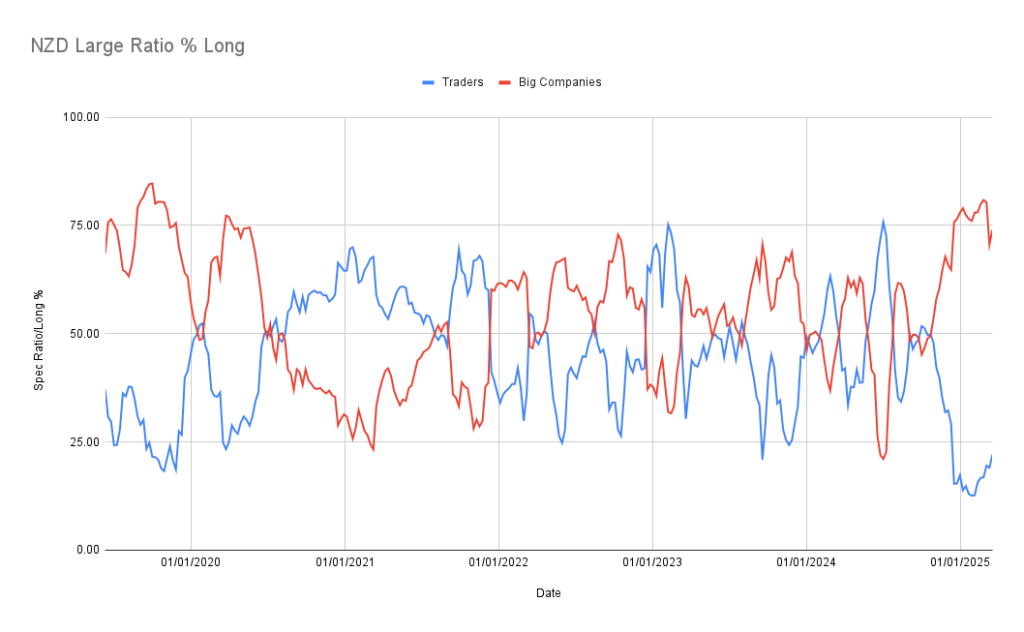
NZD Large Ratio % Long
Title: NZD Large Ratio % Long
Legend:
- Blue (Traders): Speculators (non-commercial)
- Red (Big Companies): Commercial traders (hedgers)
Interpretation:
- Speculator long ratios started below 30% in 2019 but rose steadily to over 60% by early 2021.
- From mid-2022 onward, sentiment became more volatile. Long ratios fluctuated between 20% and 70%, reflecting uncertainty.
- In late 2024, speculator long ratios plummeted again, bottoming below 25%.
- Commercials followed the opposite pattern—reducing their long ratio during peak speculator bullishness, then increasing it again as speculators turned bearish.
Insight:
This repeated divergence between commercials and speculators continues to be a key signal. Currently, commercials are increasing their long exposure just as speculators have become heavily short. This alignment often precedes a reversal in price, as commercials position for longer-term value and fundamentals.
Strategic Takeaways:
- Net speculator positioning in NZD has reached extreme bearish levels, similar to the lows seen in 2019.
- Commercial traders increasing long ratios while speculators are near record bearishness suggests a potential contrarian opportunity.
- Historically, such setups—extreme speculator shorts vs. commercial longs—mark turning points in price trends.
Traders should watch closely for signs of price basing, reversal patterns, or shifts in macro data (e.g. dairy exports, RBNZ policy tone) that support a case for long NZD positions. This setup is particularly potent if combined with oversold technicals or positive surprises in economic releases.
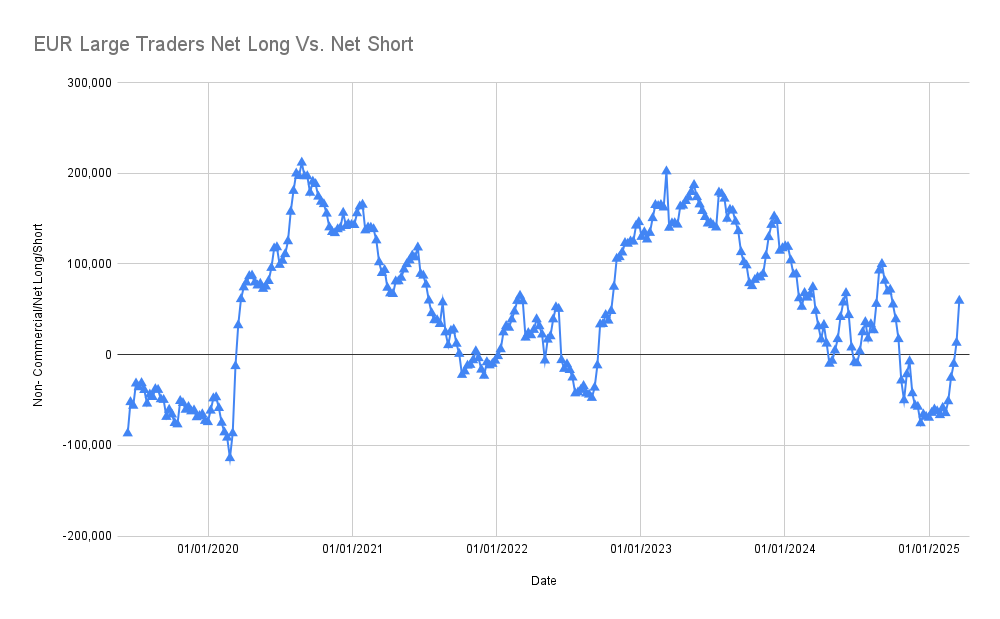
EUR Large Traders Net Long vs. Net Short
Title: EUR Large Traders Net Long vs. Net Short
Y-Axis: Net Position (Long – Short)
X-Axis: Timeline from 2019 to March 18th 2025
Interpretation:
- In early 2019 and into 2020, speculators were net short, hitting extremes around -100,000 contracts.
- There was a dramatic reversal in 2020, with net longs rising sharply and peaking above +200,000 contracts by late 2020.
- From 2021 to 2023, sentiment oscillated, with multiple swings between moderate net longs and net shorts.
- The second half of 2024 saw net short positions return, bottoming near -100,000 contracts before a small recovery in early 2025.
Insight:
These net positioning swings show significant speculative sentiment shifts over the past five years. Most recently, the return to deep net shorts by the end of 2024 signals renewed bearishness. However, the brief recovery seen in 2025 could reflect the start of a sentiment shift or short-covering. In either case, this may be a potential inflection zone.
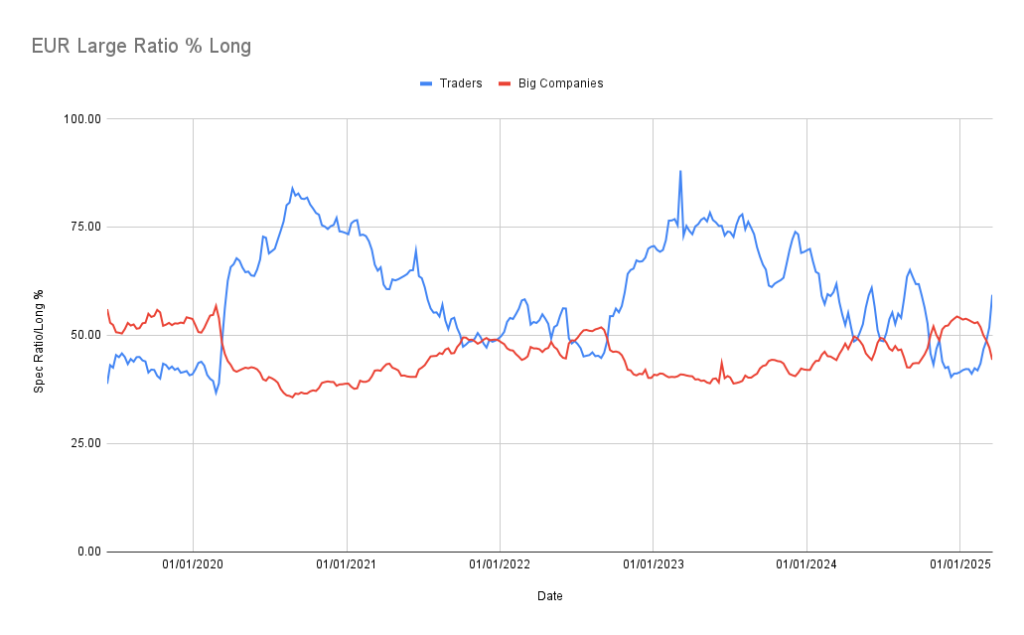
EUR Large Ratio % Long
Title: EUR Large Ratio % Long
Legend:
- Blue (Traders): Speculators (non-commercial)
- Red (Big Companies): Commercial traders (hedgers)
Interpretation:
- Between 2019 and mid-2020, speculator long ratios were relatively balanced, hovering around 40–50%.
- Starting in late 2020, speculators became increasingly bullish, with long ratios climbing to over 75%.
- A decline followed from 2021 to early 2022, bringing ratios back toward 50%, then below.
- In 2023, speculators became bullish again briefly, before another sustained slide into lower territory below 50% through late 2024.
- Commercials moved inversely throughout—reducing their long ratios during peak speculative bullishness and increasing as speculators turned bearish.
Insight:
This classic divergence—where commercials take the opposite side of speculators—continues to play out. As of early 2025, speculators are reducing their long exposure while commercials are increasing theirs. This alignment historically marks a transition zone and may precede a reversal in favor of the commercial positioning.
Strategic Takeaways:
- The EUR has experienced wide sentiment cycles, with speculative traders shifting from extremely bullish to heavily bearish over the past 5 years.
- The most recent setup shows renewed speculative pessimism (deep net shorts, falling long ratios), while commercials are becoming more constructive on the Euro.
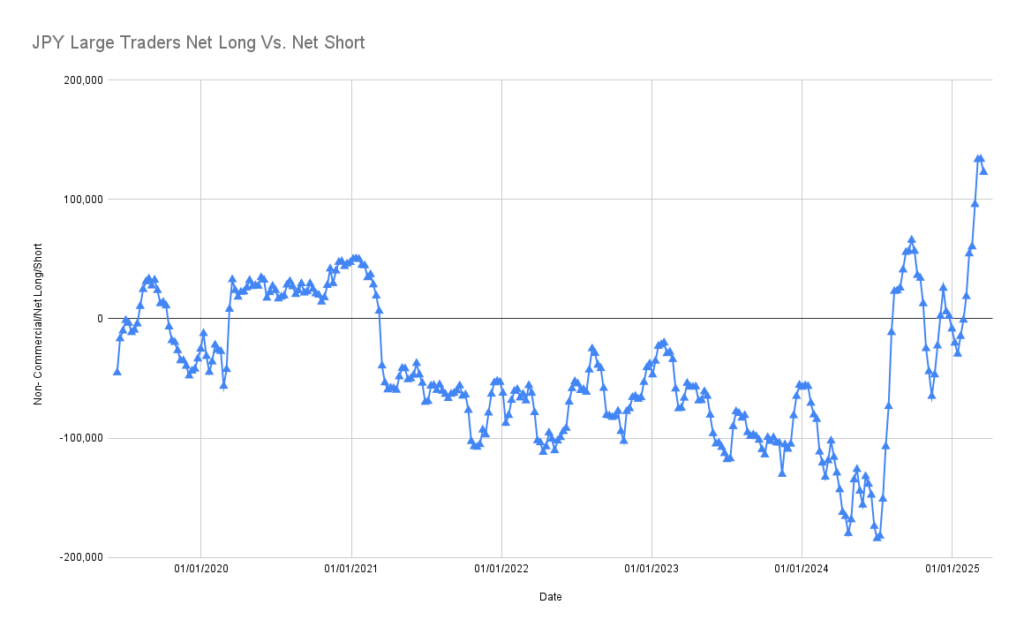
JPY Large Traders Net Long vs. Net Short
Title: JPY Large Traders Net Long vs. Net Short
Y-Axis: Net Position (Long – Short)
X-Axis: Timeline from 2019 to March 18th 2025
Interpretation:
- From 2019 through early 2021, speculators maintained a generally neutral-to-bullish stance, with net positions fluctuating near or slightly above zero.
- In 2021, sentiment sharply reversed. Traders increased short exposure, and by 2022–2023, net positioning consistently stayed in negative territory.
- A major turning point came in mid to late 2024, when speculators rapidly unwound short positions and began building longs, pushing net positioning above +100,000 contracts by early 2025—an extremely bullish shift.
Insight:
This is one of the most dramatic sentiment reversals in the dataset. After nearly two years of consistent net short exposure, speculators are now aggressively long. This likely reflects major macro or policy shifts (e.g., Bank of Japan interest rate changes or yen carry trade dynamics), and the magnitude of the reversal suggests strong conviction behind the move.
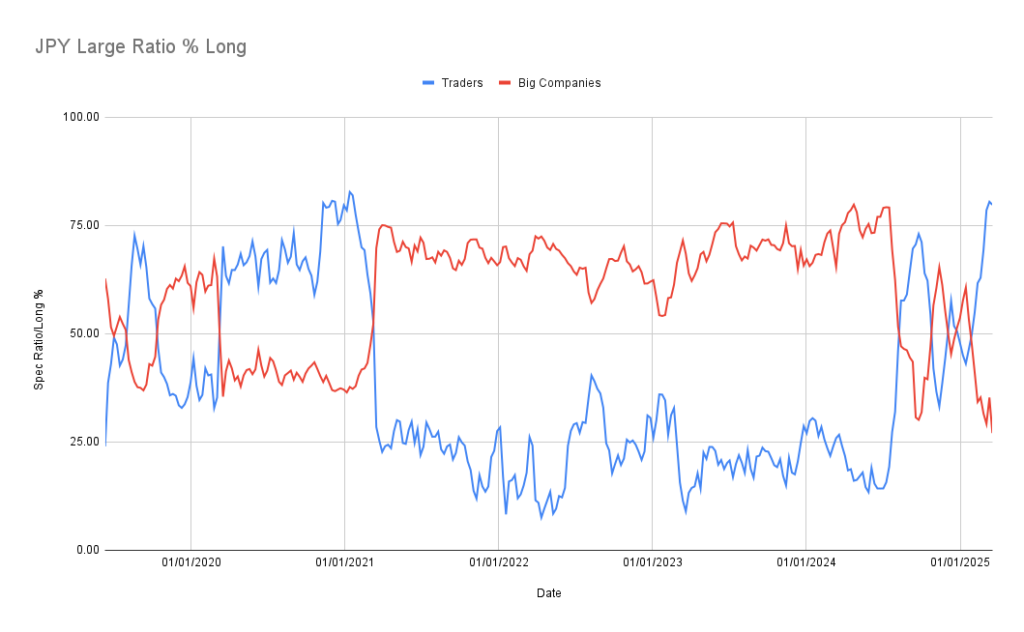
JPY Large Ratio % Long
Title: JPY Large Ratio % Long
Legend:
- Blue (Traders): Speculators (non-commercial)
- Red (Big Companies): Commercial traders (hedgers)
Interpretation:
- From 2019 to early 2021, speculator long ratios were mostly high (50% to 80%), in line with moderately bullish net positioning.
- Beginning in 2021, long ratios fell sharply, reaching sustained lows around 20–30% as net shorts built up.
- From late 2024 onward, the ratio skyrocketed, reaching over 75% in early 2025—confirming the sharp shift toward long positioning.
- Commercials followed the inverse path: as speculators turned bullish in late 2024, commercial long ratios declined, reflecting their tendency to fade speculative extremes.
Insight:
The long ratio’s spike confirms the rapid change in sentiment seen in the net positioning chart. With commercials now reducing long exposure as speculators pile in, we’re seeing a textbook case of sentiment divergence. This suggests the move may be nearing exhaustion—or at least vulnerable to correction—especially if the underlying drivers don’t sustain the trend.
Strategic Takeaways:
- JPY has undergone a strong bullish reversal in positioning, with speculators now the most net long they’ve been in years.
- Commercials are taking the opposite side of this move, as they reduce their long exposure just as speculators ramp up theirs.
- This setup suggests the JPY strength may be nearing a peak, or at least entering a phase of heightened volatility.
Traders should be cautious chasing fresh longs (Short USDJPY) at this stage. While momentum may carry the trend further, the risk of a reversal or correction increases when speculative sentiment reaches such extremes—especially when contradicted by commercial positioning. Look for divergences or weakening price action to validate any shift in bias.
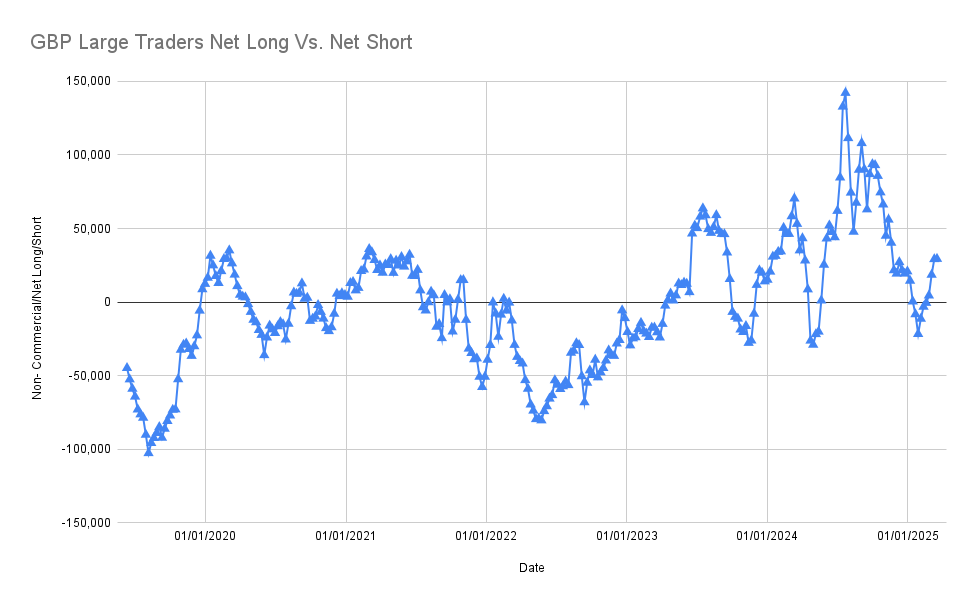
GBP Large Traders Net Long vs. Net Short
Title: GBP Large Traders Net Long vs. Net Short
Y-Axis: Net Position (Long – Short)
X-Axis: Timeline from 2019 to March 18th 2025
Interpretation:
- Speculators were heavily net short in early 2019, reaching lows near -100,000 contracts.
- A reversal took place in 2020, with net positions flipping positive and remaining relatively balanced or modestly bullish until mid-2022.
- From 2023 onward, sentiment became increasingly bullish, with net long positions peaking above +120,000 in mid-2024—one of the strongest speculative long positions in years.
- Since late 2024, net long positions have declined but remain positive heading into 2025.
Insight:
This chart reflects a clear long-term shift in sentiment. While the British Pound has seen periods of hesitation, speculators have become more confident over time. The recent tapering off from extreme bullish levels could signal profit-taking or uncertainty, but overall, speculative sentiment is still positive.
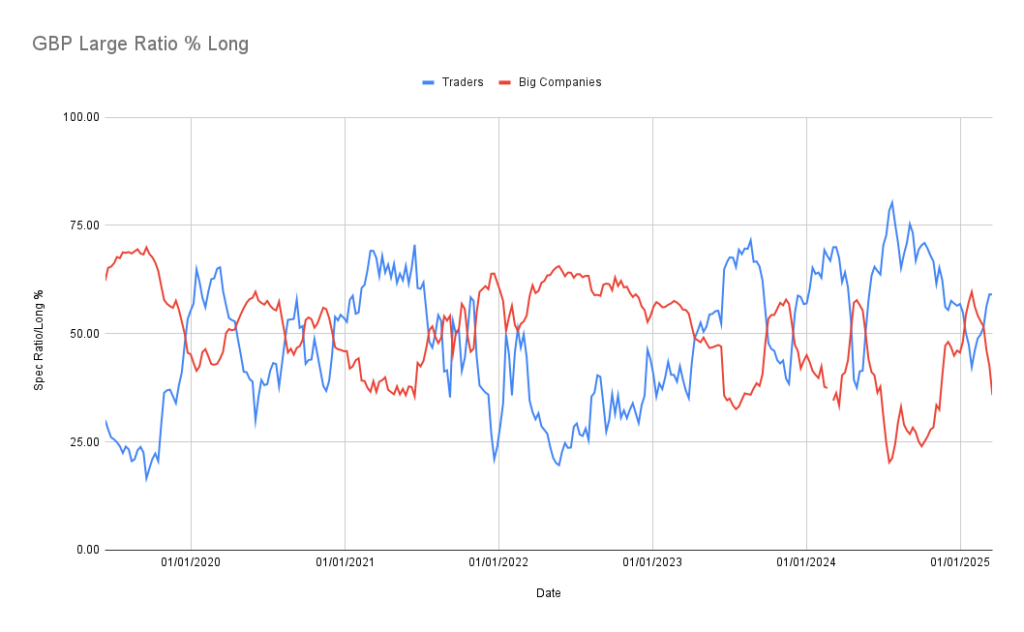
GBP Large Ratio % Long
Title: GBP Large Ratio % Long
Legend:
- Blue (Traders): Speculators (non-commercial)
- Red (Big Companies): Commercial traders (hedgers)
Interpretation:
- From 2019 to 2020, speculator long ratios increased from around 25% to over 60%, with a brief dip in 2021.
- Throughout 2022–2024, sentiment fluctuated significantly, ranging from below 25% to peaks near 75%, reflecting high volatility in trader expectations.
- In 2024 and early 2025, the long ratio remained mostly above 50%, indicating a consistent bullish tilt from speculative traders.
- Commercials, as usual, maintained the inverse stance—selling into strength when speculators are heavily long, and increasing long exposure when speculators back off.
Insight:
The recent behavior of commercials—raising their long ratios as speculator longs decline—suggests that commercials may see value in the Pound as bullish speculative momentum cools. This type of divergence can often foreshadow corrections or turning points, particularly after an extended trend.
Strategic Takeaways:
- GBP speculative sentiment is still net bullish, but recent cooling off may indicate that much of the upside has already been priced in.
- Commercials are starting to accumulate again, suggesting that dips may be seen as buying opportunities from a value perspective.
- Traders should be cautious of chasing highs. Look for signs of stabilization or new macro drivers before initiating new long positions.
Overall, while the Pound remains supported by speculative interest, the transition in commercial behavior and fading speculative extremes suggest we could be entering a consolidation or pullback phase, unless re-energized by fresh fundamental catalysts.
Disclaimer
Takezo Trading and its content, including but not limited to any advice, recommendations, analysis, and other insights, are provided for informational, entertainment and educational purposes only. We are not licensed financial advisors or experts, and the information on this site should not be interpreted as financial advice.
Always consult with a certified financial advisor or other appropriate professionals before making any investment decisions. Any actions taken based on information or insights provided by Takezo Trading are solely at your own risk. We will not be liable for any losses or damages in connection with the use of our website or its content.