A gold-anchored, cross-asset read of risk sentiment, relative value, and the highest-conviction FX trade themes based on multi-timeframe currency strength (gold) signals
Executive Summary
This week’s dashboard sends a mixed—but tradable—message:
- Risk appetite looks supported on the surface: the VIX is 14.49, and the US 10-year yield is 4.169%, which we will treat as consistent with a “risk-on” sentiment.
- But the macro “stress” indicator is still flashing: the Gold-to-Oil ratio is 76.75, far above the historical “normal” range (10–30) —suggesting gold is expensive relative to oil, which often coincides with economic stress, weak oil demand, and safe-haven preference.
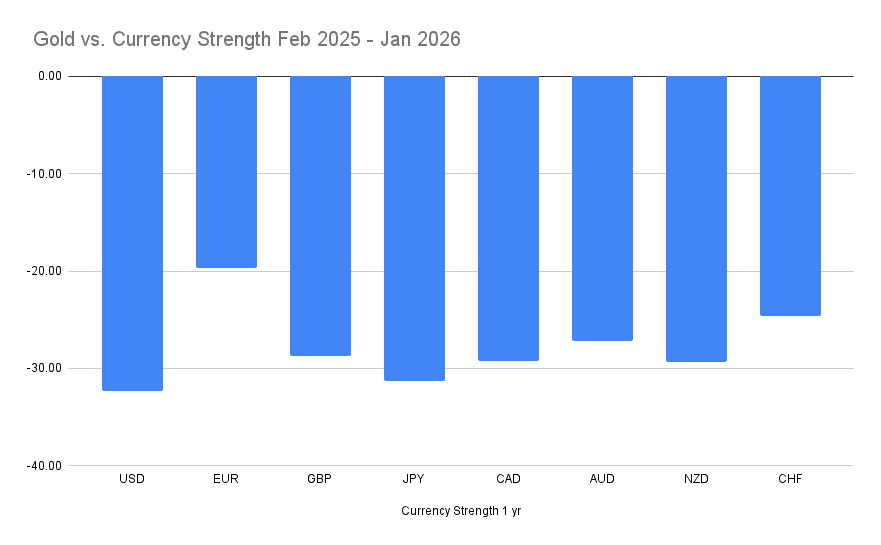
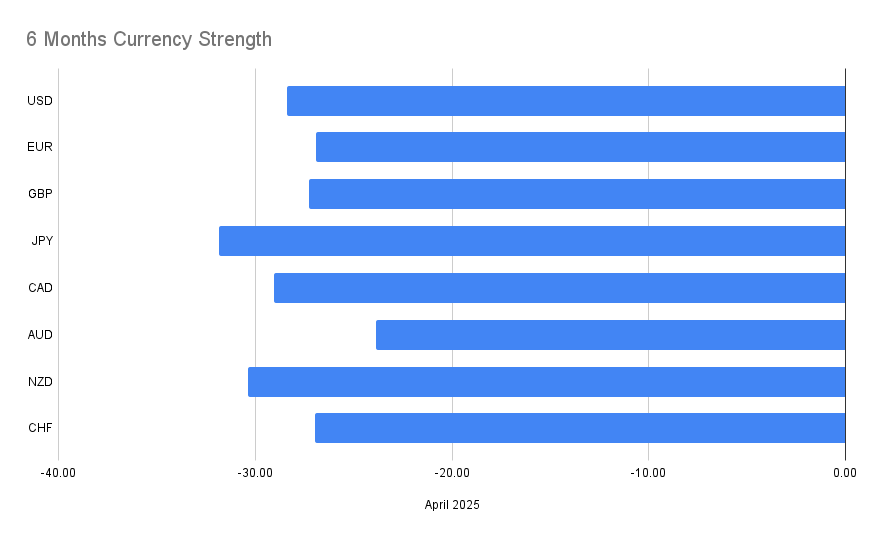
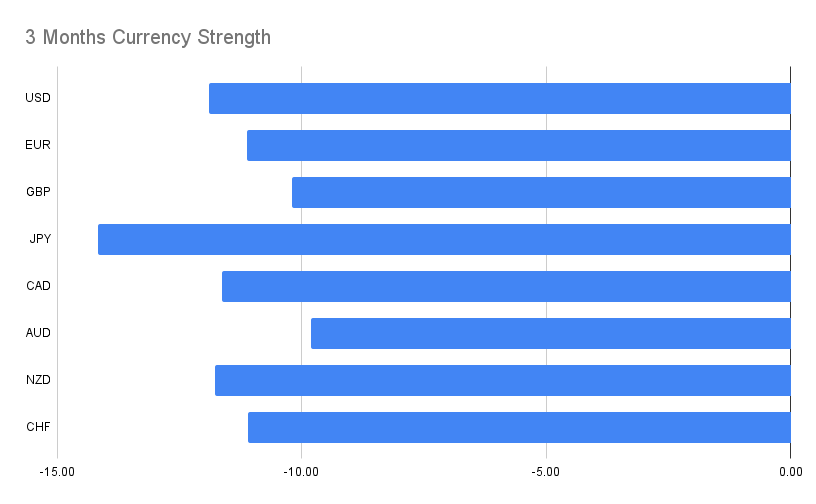
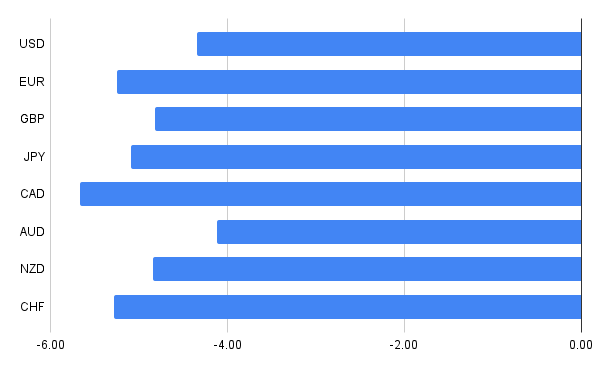
- Gold remains the dominant benchmark: the “currency strength vs gold” visuals indicate broad underperformance versus gold across multiple horizons (1-year, 6-month, 3-month, and January-to-date), meaning gold strength is still the macro backdrop, even if risk indicators look calm.
- Rates and yield differentials still matter: policy rates (e.g., USD 3.75%, GBP 3.75%, AUD 3.60%, EUR 2.15%, JPY 0.75%, CAD 2.25%) and 10-year yields (e.g., US 4.169%, UK 4.377%, Germany 2.091%, Japan 2.091%, Australia 4.676%) help frame carry incentives and funding currencies.
Global Macro Overview
1) The “two-speed” market: calm volatility, expensive hedges
For everyday readers, think of markets as having two key dials:
- Fear/uncertainty right now (often proxied by the VIX)
- Longer-term stress signals (often seen in relative pricing between safe havens and growth-sensitive assets)
This week, the VIX at 14.49 suggests markets are not currently pricing a high probability of near-term chaos. In plain English: investors are not aggressively buying short-term protection.
However, the Gold-to-Oil ratio at 76.75 tells a very different story.
- Gold being expensive relative to oil
- Oil appearing low (weak demand / weak consumption narrative)
- A configuration that often shows up during economic stress as investors prefer gold while oil prices soften
How can both be true?
Because markets can be calm today while still quietly paying up for safety structurally. Gold can remain bid even when volatility is muted—especially if investors are uncertain about growth, geopolitics, or the durability of the cycle.
Safe-Haven vs Risk Trends
The Gold-to-Oil ratio: what it means (in simple terms)
The notes explain the ratio plainly: it is how many barrels of oil one ounce of gold can buy. At 76.75, one ounce of gold buys ~76 barrels of oil. “Normal” range between 10 and 30, and markets eventually tend to move back toward those levels over time.
Why FX traders care:
- When the ratio is high, markets are often behaving as if:
- “Safety” is valuable (gold demand strong), and/or
- “Growth/consumption” is weak (oil demand weak)
- In FX, that tends to influence:
- Commodity-linked currencies (AUD, CAD, NZD) via terms-of-trade and risk appetite
- Traditional havens (JPY, CHF) via funding flows and hedging preferences
- USD via global liquidity and defensive positioning
Equity indices vs gold: “who is winning the portfolio battle?”
“index vs gold” ratios:
- S&P 500 vs Gold: 1.54
- DAX vs Gold: 6.52
- CAC 40 vs Gold: 2.16 (4–5 “average” range)
- FTSE 100 vs Gold: 3.01
- Nikkei 225 vs Gold: 0.073 (at the lower part of the normal range)
These ratios are a way to compare how equity markets are doing removing the inflationary effects of fiat currencies.
Rates, Yields, and Why They Move Currencies
If you are new to macro FX, here is the simplest rule that still works:
Currencies tend to like higher yields—until risk breaks, then they like safety.
Policy rates (the “cash rate” foundation)
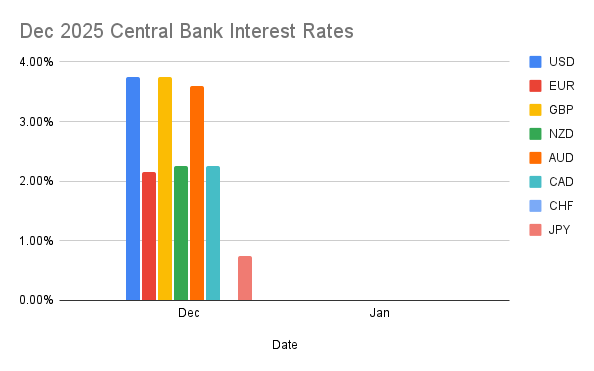
- USD: 3.75%
- EUR: 2.15%
- GBP: 3.75%
- JPY: 0.75%
- AUD: 3.60%
- CAD: 2.25%
Why this matters:
If you hold a currency with a higher rate versus another currency with a lower rate, you may earn a “carry” advantage (all else equal). That’s one reason why, in calmer times, higher-yield currencies can attract demand.
10-year yields (the market’s longer-term price of money)
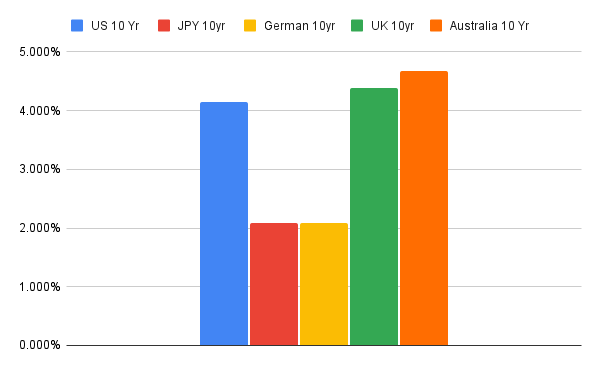
- US 10-year: 4.169%
- UK 10-year: 4.377%
- German 10-year: 2.091%
- Japanese 10-year: 2.091%
- Australia 10-year: 4.676%
Why FX cares:
Yields influence:
- Capital flows (investors buying bonds need the currency first)
- Relative attractiveness of holding assets in one country versus another
- Funding dynamics (low-rate currencies often become “funding” currencies for carry trades)
This is directly relevant to several higher probability trades (e.g., AUD crosses and JPY crosses), because they often express carry + risk sentiment at the same time.
Currency Strength vs Gold: The Core Signal
Why use gold as the benchmark?
The report’s trade selection is explicitly “based on currency strength vs gold” across multiple timeframes.
- Gold is treated here as a “global money” gold can’t be printed, and universally known as real money. Removes the inflationary effects of fiat currency.
Major Currency Breakdown (Macro + Positioning Logic)
USD (US Dollar)
- S&P 500 vs Gold: 1.54
- US 10-year yield: 4.169%;
- Policy rate: 3.75%
EUR (Euro)
- DAX vs Gold: 6.52
- CAC 40 vs Gold: 2.16, below the 4–5 “average” level
- German 10-year yield: 2.091%
- Policy rate: 2.15%, described as only higher than CHF and Japan
GBP (British Pound)
- FTSE 100 vs Gold: 3.01
- UK 10-year yield: 4.377%
- Policy rate: 3.75%
JPY (Japanese Yen)
- Nikkei 225 vs Gold: 0.073 (lower part of the normal range)
- 10-year JGB: 2.091%
- Policy rate: 0.75%
AUD (Australian Dollar)
- Australia 10-year: 4.676% (highest in the set)
- Policy rate: 3.60%
CAD (Canadian Dollar)
- Policy rate: 2.25%
Commodities & FX Correlations
Gold remains the anchor; oil is the “growth thermometer”
- Gold is relatively expensive vs oil, ratio still very high though down from last week, and this is associated with weak oil demand and strength in Gold.
In FX terms:
- When oil is weak and gold is strong, markets often favor:
- Defensive allocations (gold, sometimes USD/JPY/CHF depending on the Macro environment)
- Selective risk rather than broad risk chasing
Market Risks & Forward Guidance
What could invalidate the framework this week?
- Volatility sentiment shifts
If VIX moves higher above $30, broad risk positioning could unwind. That typically hits high-beta currencies first and can change carry dynamics quickly. - Oil rebound / gold correction (ratio compression)
If oil rallies sharply and/or gold corrects, the Gold-to-Oil ratio would compress. That can represent improving growth sentiment and may re-rank commodity currencies and safe havens. - Sharp unwinding of the JPY Carry trades
Forward guidance (process):
Continue to treat gold as the benchmark, and prioritize trades that show 3-timeframe or 4-timeframe confirmation, as the report’s signal process intends.
High probability Trades (Timeline 3 & 4 Only)
Below are only the trades explicitly listed as:
- “Trades present in only 3 time frames” and
- “Trades present in all 4 time frames”
Trade Table (3-Timeframe and 4-Timeframe Consensus)
| Confluences | Pair | Direction |
| 3 timeframes | AUDCAD | BUY |
| 3 timeframes | AUDNZD | BUY |
| 3 timeframes | CADCHF | SELL |
| 3 timeframes | CADJPY | BUY |
| 3 timeframes | CHFJPY | BUY |
| 3 timeframes | EURAUD | SELL |
| 3 timeframes | EURNZD | BUY |
| 3 timeframes | EURJPY | BUY |
| 3 timeframes | GBPNZD | BUY |
| 3 timeframes | NZDCHF | SELL |
| 3 timeframes | USDCHF | SELL |
| 3 timeframes | USDJPY | BUY |
| all 4 timeframes | AUDJPY | BUY |
| all 4 timeframes | AUDUSD | BUY |
| all 4 timeframes | EURCAD | BUY |
| all 4 timeframes | GBPAUD | SELL |
| all 4 timeframes | GBPCAD | BUY |
| all 4 timeframes | GBPJPY | BUY |
| all 4 timeframes | NZDJPY | BUY |
Conclusion
The report’s message is coherent once you view it through its intended lens:
- Surface risk looks calm (VIX at 14.49; yields consistent with “risk-on” environment).
- But the deeper macro anchor is still defensive (Gold-to-Oil ratio at 76.75 keeps the “stress / gold preference” narrative alive).