Gold, Rates, and Risk: A Cross-Asset Framework for High-Conviction FX Positioning
A comprehensive macro-FX assessment integrating gold benchmarks, yield differentials, equity risk signals, and multi-timeframe currency alignment.
Executive Summary
As we close the final trading week of December 2025, global markets sit at a nuanced inflection point rather than a binary “risk-on” or “risk-off” regime. Volatility remains subdued, with the VIX at 13.60, while equity-to-gold ratios and sovereign yields continue to reflect resilience in risk assets. However, beneath the surface, several macro indicators—most notably the elevated Gold-to-Oil ratio at 79.62—signal underlying economic stress, demand weakness in energy markets, and persistent capital allocation toward safety.
This report integrates cross-asset indicators—gold as a universal benchmark, equity-to-gold ratios, interest-rate differentials, and multi-horizon currency strength—to build a structured FX outlook. While the near-term environment justifies selective risk exposure, longer-horizon data continues to favor currencies with relative yield support and structural strength against persistently weak funding currencies, particularly the Japanese yen and Swiss franc.
The highest-conviction opportunities remain those that align across three and four distinct timeframes, reinforcing directional consistency and reducing noise.
Global Macro Overview
Volatility and Market Psychology
The VIX index at 13.60 remains firmly below long-term averages, indicating calm equity markets and limited demand for downside protection. Historically, such levels are associated with stable or rising equity prices and an absence of acute systemic stress. From an FX perspective, this environment typically favors carry, yield differentials, and relative growth narratives over pure safe-haven demand.
However, low volatility should not be misinterpreted as the absence of risk. Instead, it often reflects complacency, where capital is efficiently allocated until a catalyst emerges. In such regimes, currencies tend to move more cleanly in response to macro fundamentals rather than headline shocks.
Gold-to-Oil Ratio: A Silent Warning Signal
The Gold-to-Oil ratio stands at 79.62, down from last week but still historically elevated. In practical terms, one ounce of gold purchases nearly 79 barrels of oil, far above the long-term equilibrium range of 10–30.
This divergence conveys two critical messages:
- Gold reflecting long-term hedging demand, monetary uncertainty, and geopolitical risk.
- Oil prices are depressed, signaling weak global demand, subdued industrial activity, or excess supply.
For FX traders, this ratio is not a timing tool but a macro context indicator. Elevated levels are typically observed during periods of economic stress, even when equity markets appear stable. The implication is clear: risk assets may be supported tactically, but the macro cycle remains fragile.
Rates, Bonds, and Yield Differentials
Central Bank Policy Landscape
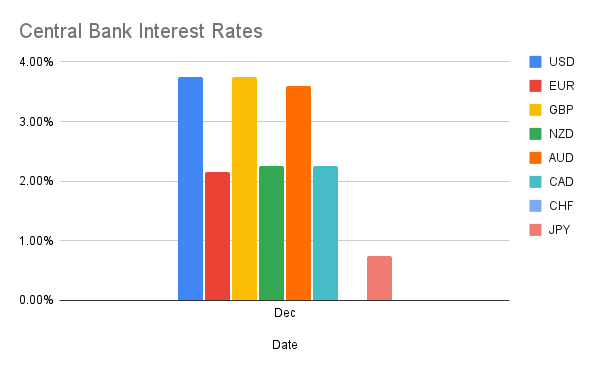
Interest-rate differentials remain one of the most reliable drivers of medium- to long-term FX trends. As of late December:
- USD: 3.75% policy rate
- GBP: 3.75%
- AUD: 3.60%
- EUR: 2.15%
- CAD: 2.25%
- JPY: 0.75%
- CHF: Lowest among G10 peers
This hierarchy continues to favor high-yield and growth-linked currencies over traditional funding currencies. Importantly, while markets may price future easing cycles, spot FX continues to respond to current yield advantage, particularly in carry-sensitive pairs.
10-Year Government Bond Yields
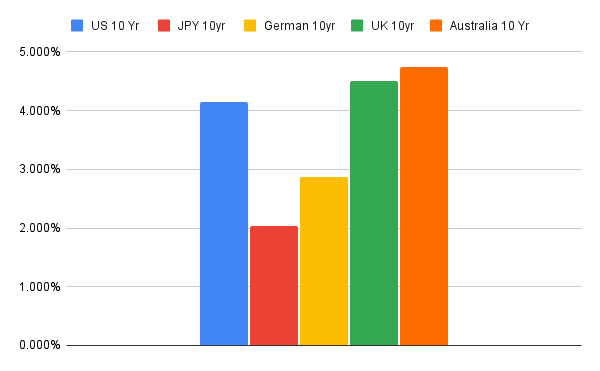
Sovereign bond markets reinforce this narrative:
- United States: 4.132%
- United Kingdom: 4.508%
- Australia: 4.739% (highest among peers)
- Germany: 2.863%
- Japan: 2.043%
The persistence of elevated long-end yields in the US, UK, and Australia reflects both inflation resilience and fiscal supply dynamics. From an FX standpoint, these yields act as a magnet for global capital, supporting currencies on a relative basis even in the absence of strong growth surprises.
Japan remains the structural outlier. Despite modest increases in JGB yields, they remain insufficient to alter the yen’s role as a funding currency, particularly when global carry opportunities persist.
Currency Strength Through the Gold Lens
Gold-denominated analysis strips out fiat bias and reveals true relative purchasing power trends.
Three-Month Horizon
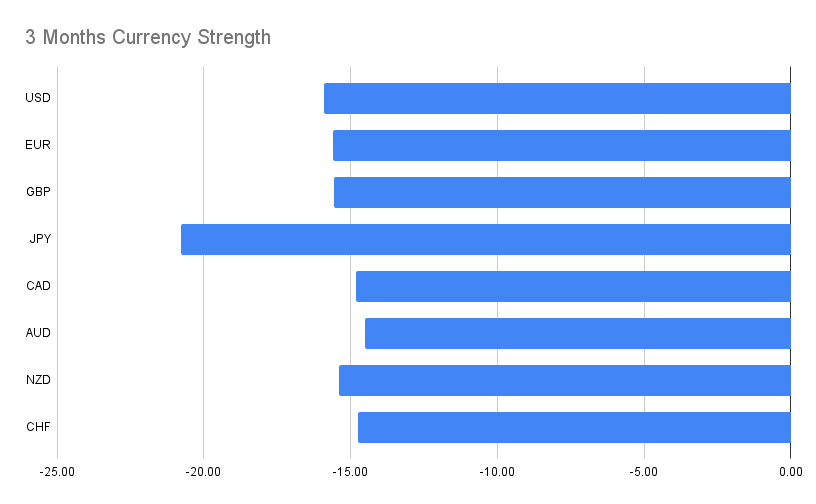
Over the past three months, all major currencies have weakened versus gold, but the degree of weakness varies meaningfully:
- JPY remains the weakest, reflecting continued capital outflows and yield disadvantage.
- USD, EUR, GBP show moderate declines, suggesting relative stability.
- AUD, NZD, CAD occupy a middle ground, pressured by commodity dynamics but supported by yield.
This configuration favors long positions against JPY .
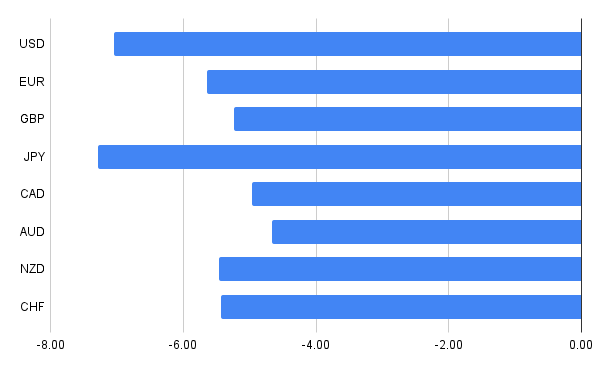
Six-Month Horizon
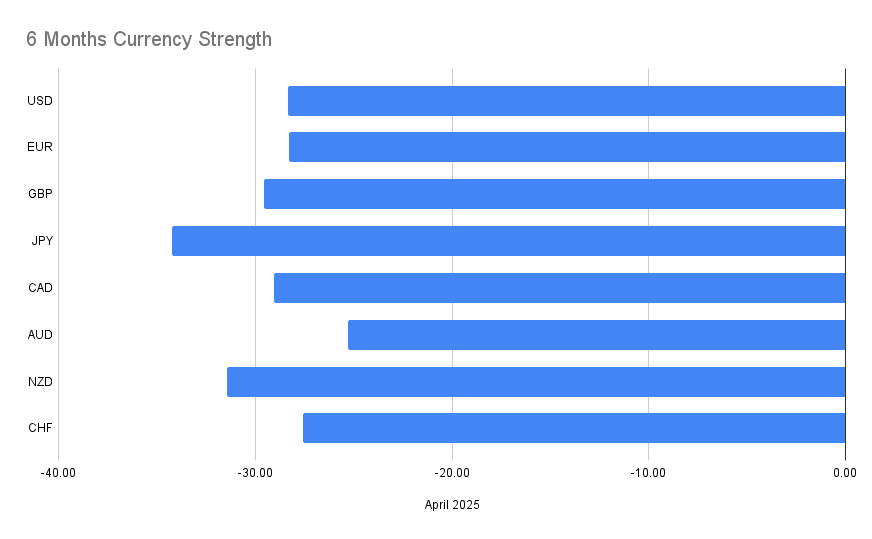
The six-month view amplifies these trends:
- JPY weakness deepens further, reinforcing its status as the primary funding currency.
- USD and EUR show consistent erosion against gold, highlighting the metal’s dominance rather than currency collapse.
- Commodity currencies remain mixed, reflecting cross-currents between yield support and global demand uncertainty.
One-Year Perspective
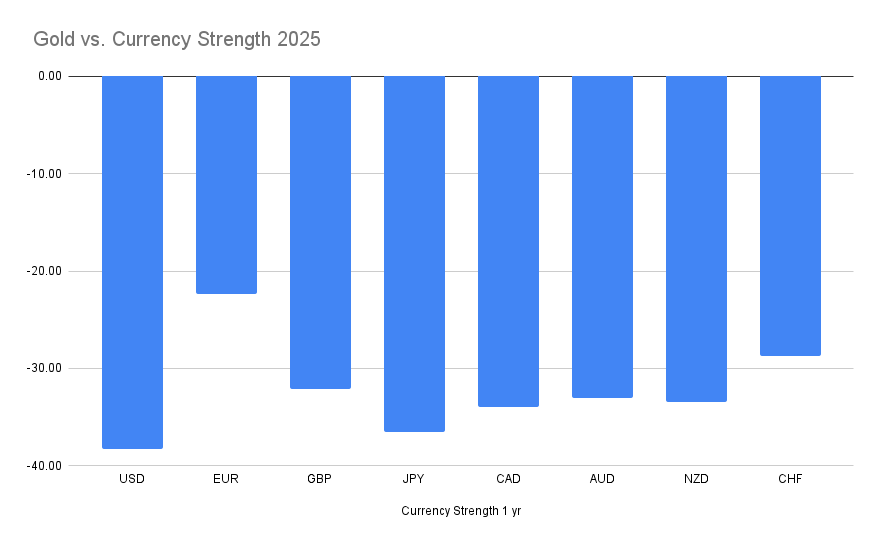
On a one-year basis, gold has outperformed all major currencies decisively:
- USD shows the largest relative decline, underscoring gold’s role as a long-term store of value.
- EUR and GBP follow, while CHF holds up slightly better.
- JPY remains persistently weak, with no structural reversal evident.
The takeaway is not to chase gold higher in FX terms, but to recognize that currencies must be evaluated relative to one another, not against a universally strong benchmark.
Equities vs Gold: Risk Context by Region
United States
The S&P 500-to-Gold ratio stands at 1.53, supporting the assumption of a “risk-on” operating environment. This ratio suggests equities are still favored relative to gold, even if not at euphoric extremes. Combined with a 4.132% 10-year yield, the USD retains cyclical support.
Eurozone
European equity-to-gold ratios present a more nuanced picture:
- DAX vs Gold at 6.32 sits near average historical levels.
- CAC 40 vs Gold at 2.10 remains below its typical range of 4–5, indicating relative underperformance.
These metrics align with Europe’s lower yield profile and more constrained growth outlook, justifying selective EUR weakness in cross pairs.
United Kingdom
The FTSE 100-to-Gold ratio at 2.05 reflects a market that is neither stressed nor exuberant. With UK yields among the highest in G10, sterling retains support in yield-driven trades, particularly versus low-yielders.
Japan
The Nikkei 225-to-Gold ratio at 0.071 sits at the lower end of its historical range. This underscores Japan’s chronic underperformance in real terms and reinforces the structural bearish case for JPY.
Safe-Haven vs Risk Dynamics
Despite low volatility and stable equities, traditional safe havens have not regained leadership:
- Gold remains strong, but primarily as a long-term hedge rather than a short-term risk-off signal.
- JPY and CHF continue to underperform, reflecting yield suppression rather than flight-to-quality demand.
This divergence suggests a regime best described as conditional risk-on: investors are willing to hold risk and carry exposure, but maintain gold as strategic insurance.
Recommended Trades – Multi-Timeframe Alignment Only
The following trades are selected strictly from setups that appear in three or all four timeframes, representing the highest-conviction expressions of the macro themes outlined above.
Trades Appearing in All Four Timeframes
These trades reflect consistent directional agreement across all horizons and form the core portfolio bias.
| Pair | Direction |
| EURUSD | BUY |
| USDCAD | SELL |
| AUDUSD | BUY |
| NZDUSD | BUY |
| USDCHF | SELL |
| EURJPY | BUY |
| GBPJPY | BUY |
| GBPNZD | BUY |
| CADJPY | BUY |
| AUDJPY | BUY |
| NZDJPY | BUY |
| CHFJPY | BUY |
Trades Appearing in Three Timeframes
These trades remain valid but warrant slightly more tactical management.
| Pair | Direction |
| GBPUSD | BUY |
| USDJPY | BUY |
| EURAUD | SELL |
| EURCHF | SELL |
| GBPCAD | SELL |
| GBPAUD | SELL |
| GBPCHF | SELL |
| AUDCAD | BUY |
| AUDNZD | BUY |
| NZDCHF | SELL |
Market Risks and Forward Guidance
Several risks warrant monitoring into early 2026:
- Volatility Regime Shift: A sudden spike in VIX could temporarily unwind carry trades.
- Energy Repricing: A sharp rebound in oil could compress the Gold-to-Oil ratio, altering commodity FX dynamics.
- Policy Surprises: Any deviation from expected central-bank paths, particularly in Japan, could disrupt entrenched trends.
That said, none of these risks currently invalidate the prevailing framework.
Conclusion
The late-December macro landscape supports a disciplined, yield-aware FX approach rather than defensive positioning. While gold’s dominance and the elevated Gold-to-Oil ratio caution against complacency, the absence of acute stress allows high-conviction trends to persist.
Currencies continue to be best traded relative to one another, not against absolute benchmarks. In this context, the persistent weakness of the Japanese yen, the resilience of high-yield currencies, and the selective strength of USD-linked trades define the opportunity set.
As we transition into the new year, traders should prioritize alignment across multiple timeframes, respect gold-based strength metrics, and remain adaptable should volatility regimes change. For now, the path of least resistance remains clearly defined—and the highest-probability trades are those that respect it.