
Week ending: May 9th, 2026 | By Takezo Trading | www.takezotrading.com
A gold-anchored read of the FX complex, cross-checked against CFTC positioning and a noisy macro backdrop. High-conviction setups, secondary watchlist, and what could break them.
Gold has spent most of the past year humbling fiat currencies. Every G10 cross has bled value against bullion across YTD and 6-month windows. Over the last three months, however, gold has been consolidating, and currencies have begun clawing back ground — a regime shift worth respecting.
When we line up four time horizons (YTD 2026, 6 months, 3 months, and May month-to-date) and rank each currency by its performance against gold, two themes dominate:
- AUD and CHF lead the strength tables on the long horizons.
- JPY and CAD anchor the bottom — chronic underperformers across nearly every window.
- NZD has flipped to #1 in May 2026 alone. That is the divergence you want to mark in red ink.
This gives us a clean framework for high-conviction trend-aligned trades, and a separate set of “almost-aligned” pairs where a single timeframe breaks the pattern — which often signals where the next regime turn is starting.
Why Use Gold as the Benchmark?
When you measure GBP/USD or EUR/JPY in isolation, you only see the relative spread between two fiat ledgers — both of which can be debasing simultaneously. Gold strips the cleaner question out: which currencies are losing the least purchasing power against the only money that doesn’t print itself?
It’s not a perfect tool. Gold has its own demand drivers — central bank reserve diversification, geopolitical hedging, real yield dynamics. But in a regime where gold is grinding higher against everything (1-yr and 6-mo charts), the order of the losers tells you which fiat units the market is least willing to dump. That ordering is what we trade against.
For more on the gold-to-oil ratio framework I use to read commodity-linked FX, see: The Gold-to-Oil Ratio: A Historical and Practical Guide.
Currency Strength Across Four Timeframes
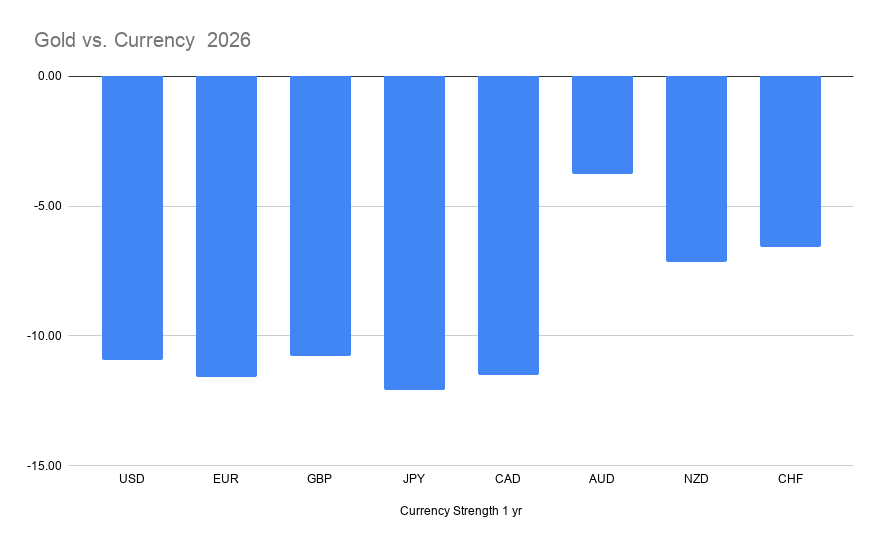
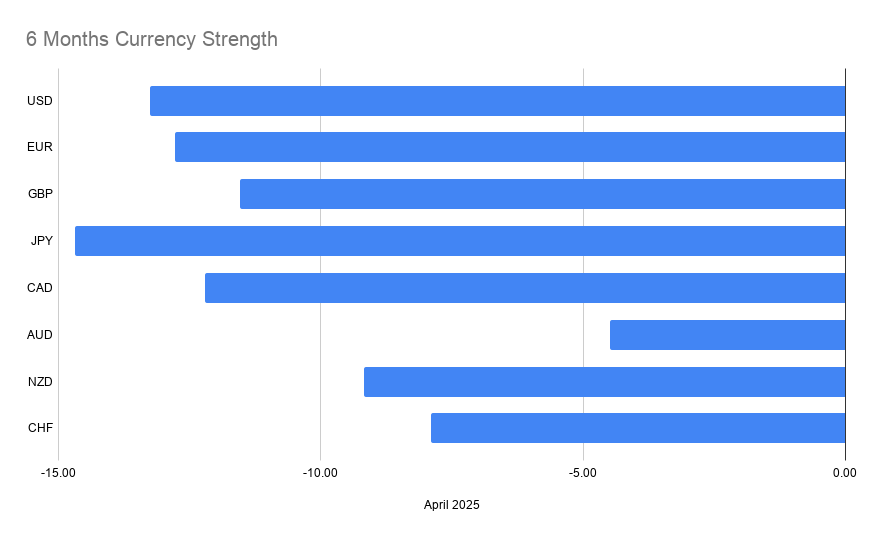
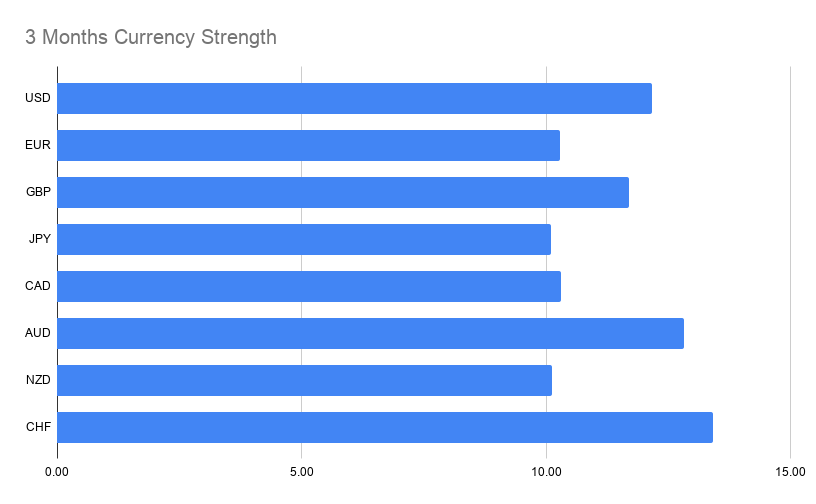
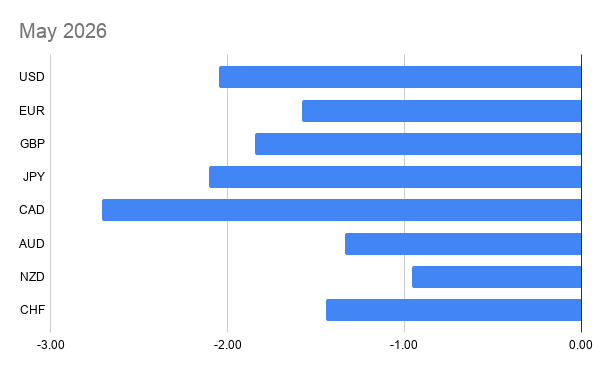
Here are the rankings I extracted from each chart, strongest currency at the top:
| Rank | YTD 2026 | 6 Months | 3 Months | May 2026 |
|---|---|---|---|---|
| 1 | AUD | AUD | CHF | NZD |
| 2 | CHF | CHF | AUD | AUD |
| 3 | NZD | NZD | USD | CHF |
| 4 | GBP | GBP | GBP | EUR |
| 5 | USD | CAD | EUR | GBP |
| 6 | CAD | USD | CAD | USD |
| 7 | EUR | EUR | NZD | JPY |
| 8 | JPY | JPY | JPY | CAD |
A few observations before we get to trades:
- JPY is bottom-three in every single window. It is the one currency you can be structurally short against the strong side.
- CAD has cratered in May. From mid-pack on the 3-month and 6-month windows, it dropped to dead last in May — likely tied to oil dynamics and BoC’s 2.25% policy rate looking out of step with rising inflation pressure.
- NZD’s leap from #7 (3M) to #1 (May) is the most aggressive single-month rotation on the board. Hold that thought — the COT data has something to say about it.
- CHF is #1 on the 3-month read. Despite gold consolidation, the franc has been quietly outperforming, consistent with safe-haven demand around the Iran conflict.
High-Conviction Trades — Aligned in All Four Timeframes
These are pairs where the same currency has been stronger than the other in every one of the four timeframes. This is the trend-following core of the book.
| # | Trade | Direction | Notes |
|---|---|---|---|
| 1 | AUD/JPY | Long | The flagship momentum + carry trade. AUD #1–#2 every window, JPY rock-bottom. |
| 2 | AUD/USD | Long | Trend-aligned, also a carry play (4.35% vs 3.75%). |
| 3 | AUD/CAD | Long | Two commodity currencies; AUD has the rate edge and the trend. |
| 4 | EUR/AUD | Short | AUD outperforming EUR across the board. |
| 5 | GBP/AUD | Short | Same logic, against sterling. |
| 6 | CHF/JPY | Long | Twin of AUD/JPY but funded with safe-haven flows instead of yield. |
| 7 | USD/CHF | Short | CHF stronger in every window; gold consolidation hasn’t helped USD. |
| 8 | EUR/CHF | Short | Classic franc-strength expression. |
| 9 | GBP/CHF | Short | Sterling cannot keep up with the franc. |
| 10 | CAD/CHF | Short | Two-way wind: CAD weakening, CHF strengthening. |
| 11 | USD/JPY | Long | Yield + trend; the rate gap (3.75% vs 0.75%) does the work. |
| 12 | EUR/JPY | Long | Trend-aligned even with EUR’s mediocre standing. |
| 13 | GBP/JPY | Long | Carry-friendly (3.75% vs 0.75%). |
| 14 | NZD/JPY | Long | Trend-aligned despite NZD’s mid-table standing. |
| 15 | GBP/CAD | Long | One of the few non-JPY, non-CHF, non-AUD setups that screens cleanly. |
The cleanest expressions of the dominant themes are AUD/JPY, CHF/JPY, EUR/AUD, and USD/CHF. If you only had room for four positions on the book, those four capture the strong/weak axes most efficiently.
Secondary Watchlist — Aligned in Three of Four Timeframes
These pairs broke alignment in exactly one window. They aren’t disqualified — they’re a tier down in conviction, but the broken timeframe often tells you something useful about an emerging regime change.
| # | Trade | Direction | Broke In | Why It Matters |
|---|---|---|---|---|
| 1 | USD/CAD | Long | 6M | USD weak on the medium horizon, but trend reasserted recently. |
| 2 | GBP/USD | Long | 3M | USD outperformed sterling on 3M; trend may be reversing back. |
| 3 | EUR/GBP | Short | May | GBP underperformed EUR in May only — watch for May to confirm or reverse. |
| 4 | CAD/JPY | Long | May | CAD’s May collapse is the wildcard; trend is still up otherwise. |
| 5 | AUD/NZD | Long | May | NZD’s May breakout flipped this pair. |
| 6 | AUD/CHF | Long | 3M | CHF leadership over the last 3M is the threat. |
| 7 | NZD/USD | Long | 3M | Same NZD reversal story. |
| 8 | EUR/NZD | Short | 3M | Bet on NZD strength continuing. |
| 9 | GBP/NZD | Short | 3M | Same NZD bet. |
| 10 | NZD/CAD | Long | 3M | NZD leading kiwi-loonie cross outright. |
| 11 | NZD/CHF | Short | May | The franc held up except in May. |
Pattern recognition: Six of the eleven 3-of-4 pairs involve NZD, all of them broken in either the 3M or May window. That’s not noise — that’s a currency in transition. NZD spent most of the year mid-pack to weak, then ripped to #1 in May. Either it was oversold and is mean-reverting, or something fundamental has changed. The COT data leans toward the former.
COT Positioning Overlay — Where Speculators Are Crowded or Cornered
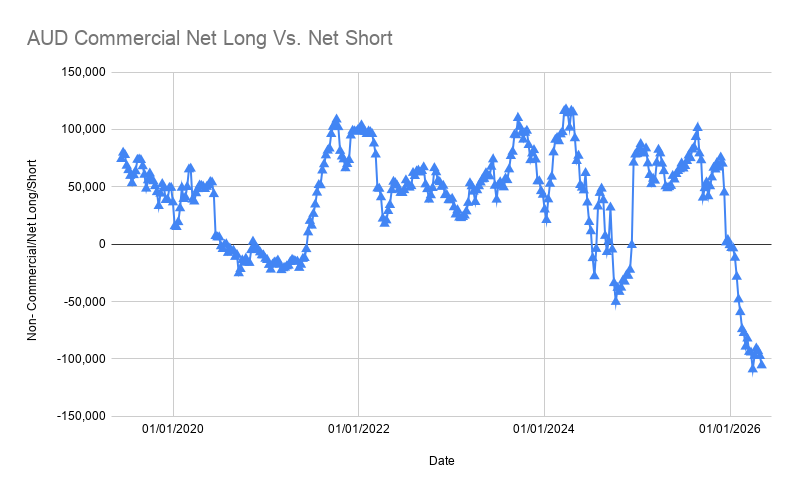
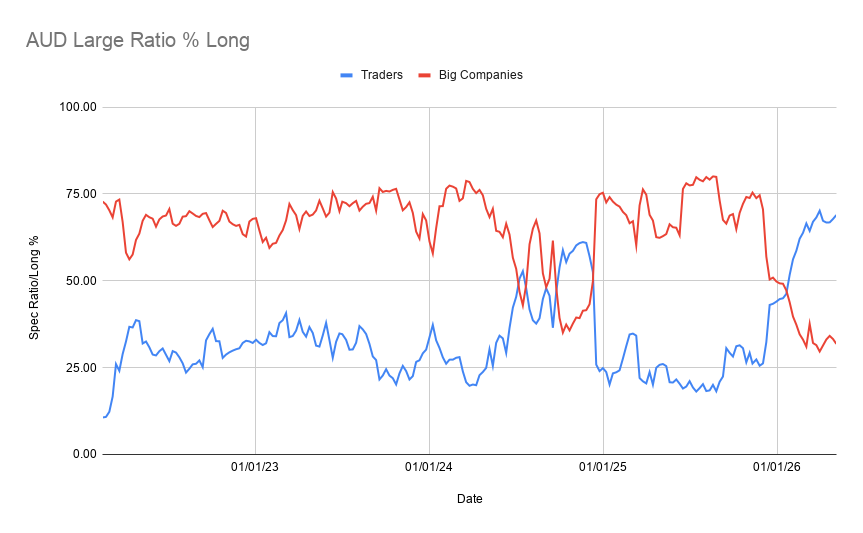
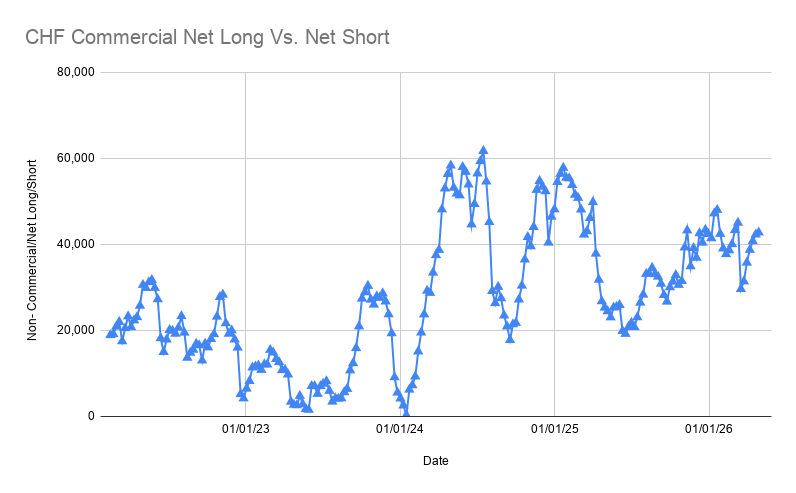
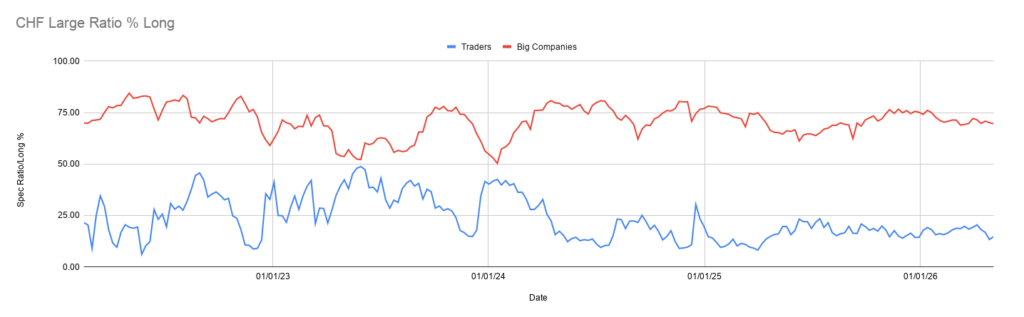
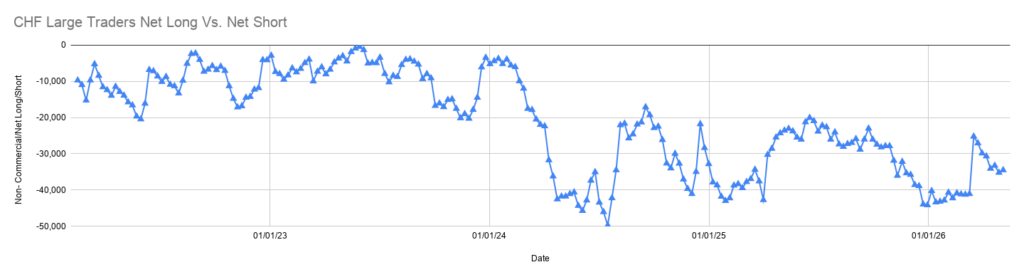
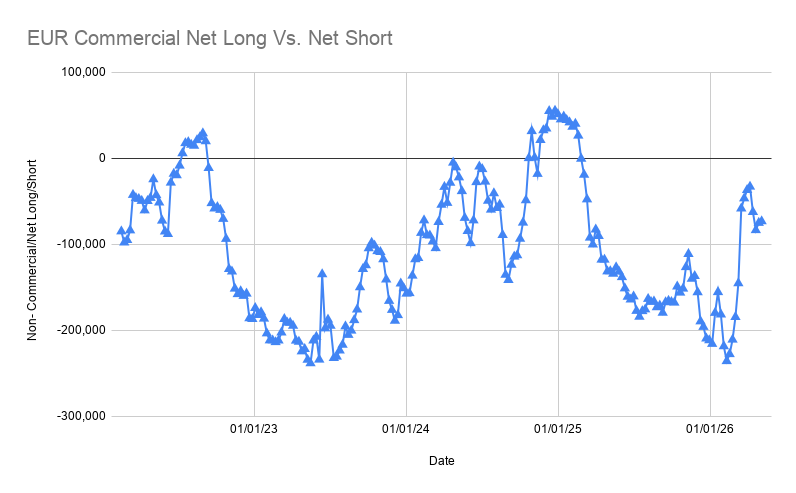
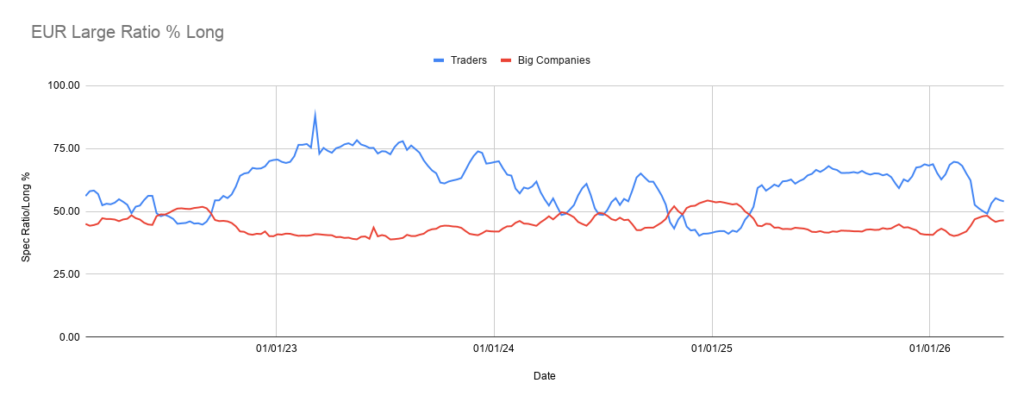
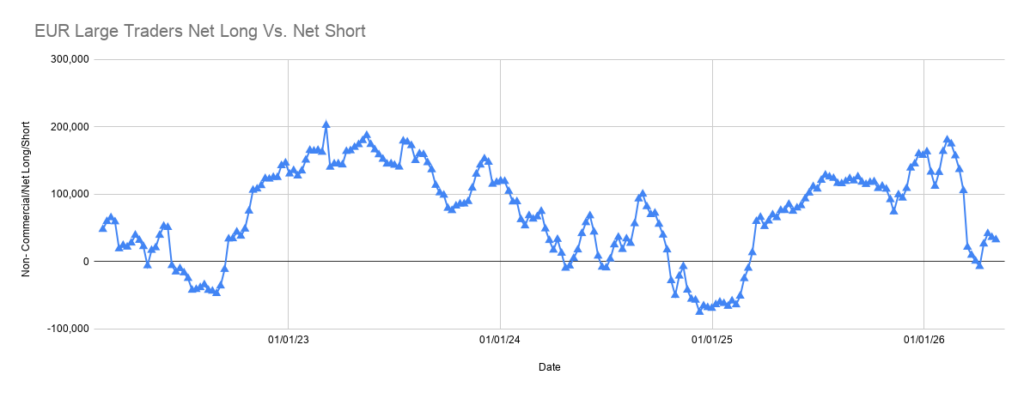
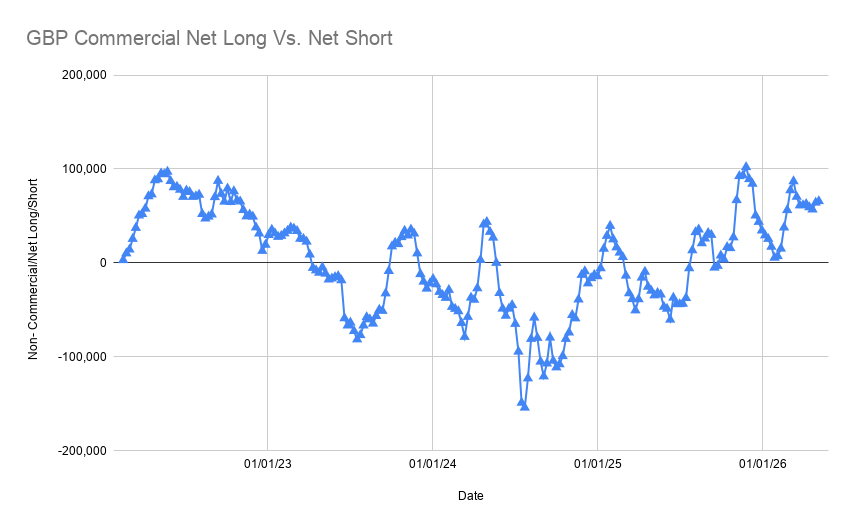
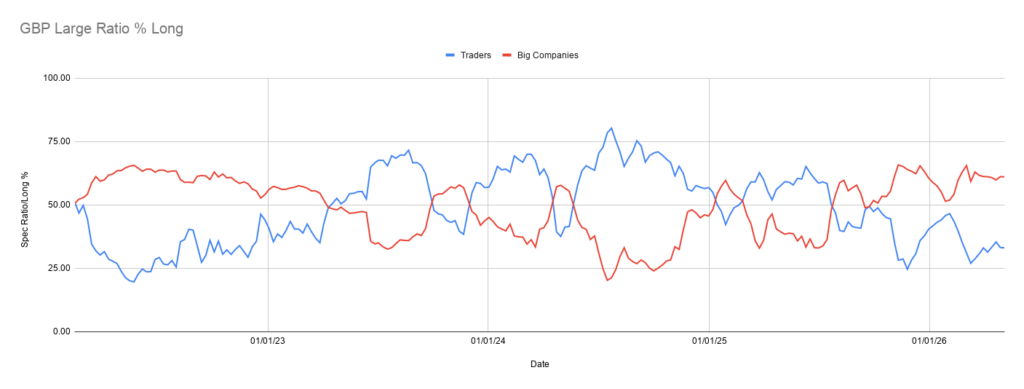
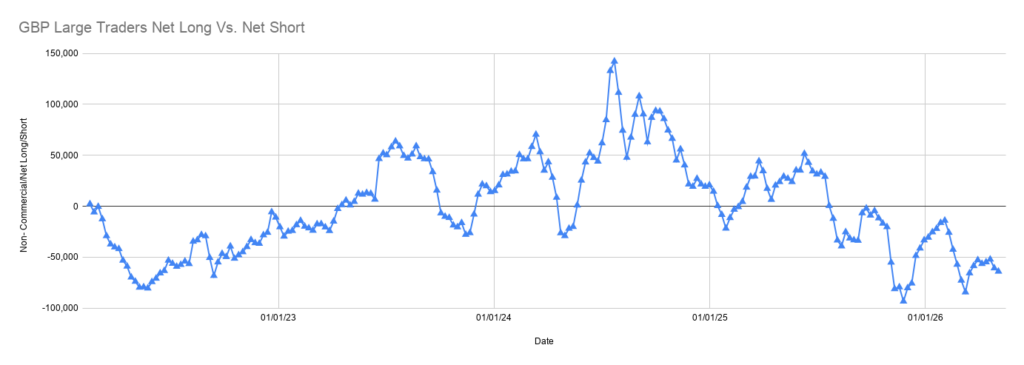
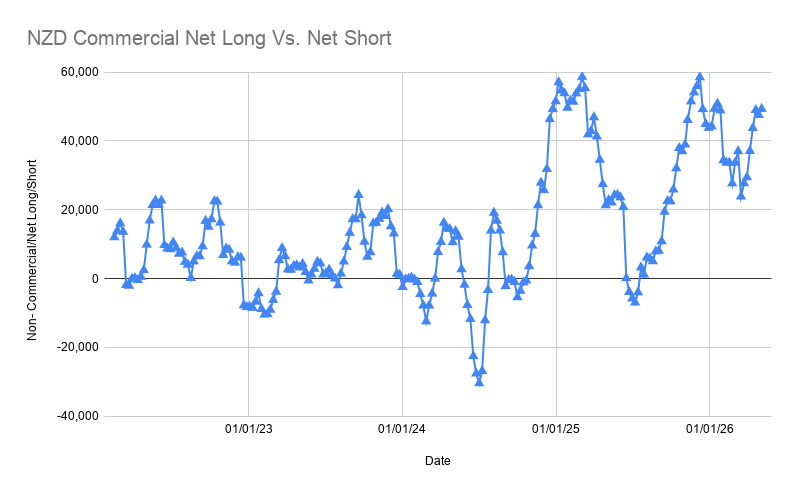
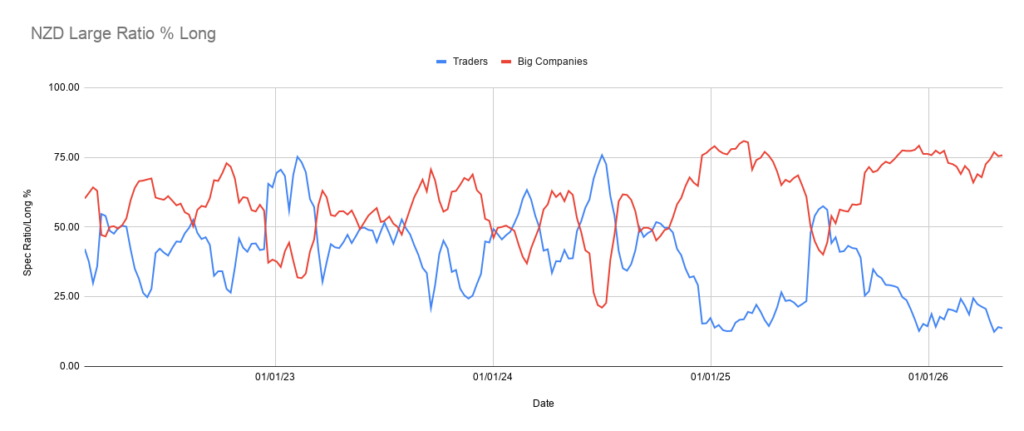
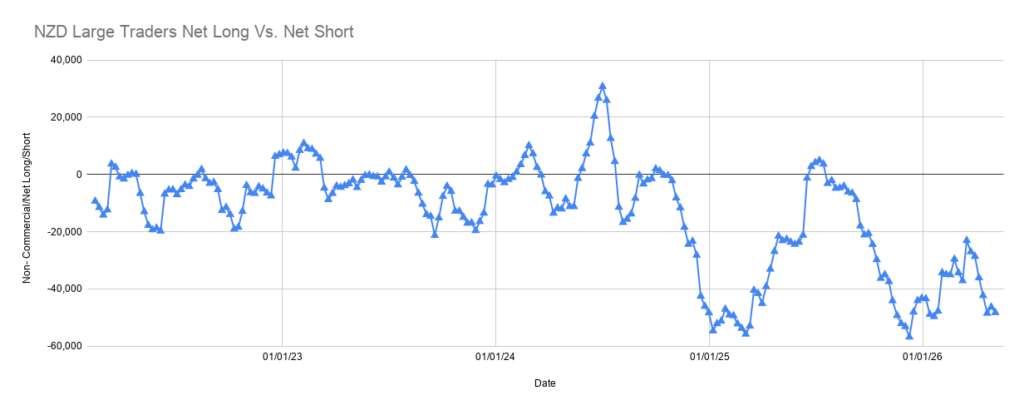
Trade ideas built only from price action ignore who is on each side. The May 9th CFTC report adds critical color:
| Currency | Speculators | % Long Ratio | Reading |
|---|---|---|---|
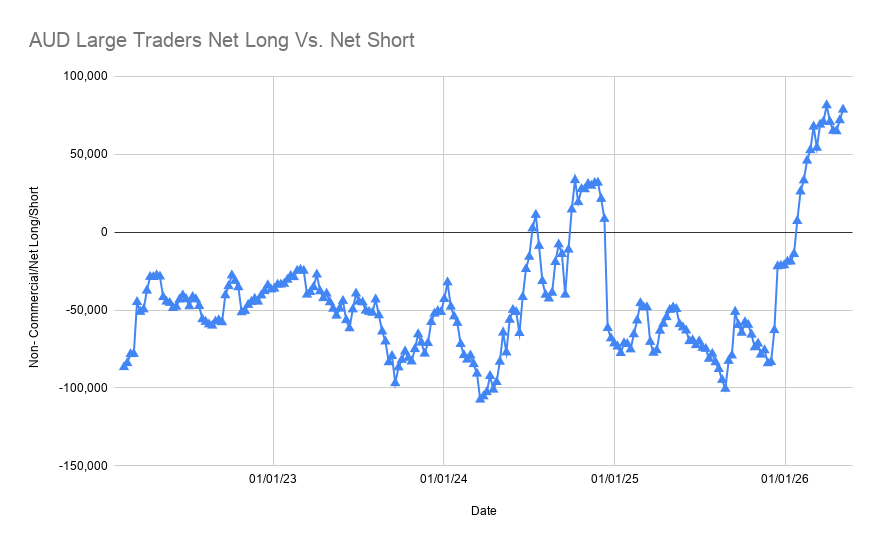
| AUD | Net long +78,674 | 68.93% | Crowded long — overcrowded, trade-aligned but vulnerable to unwind |
| EUR | Net long +32,202 | 54.00% | Mildly bullish, room either way |
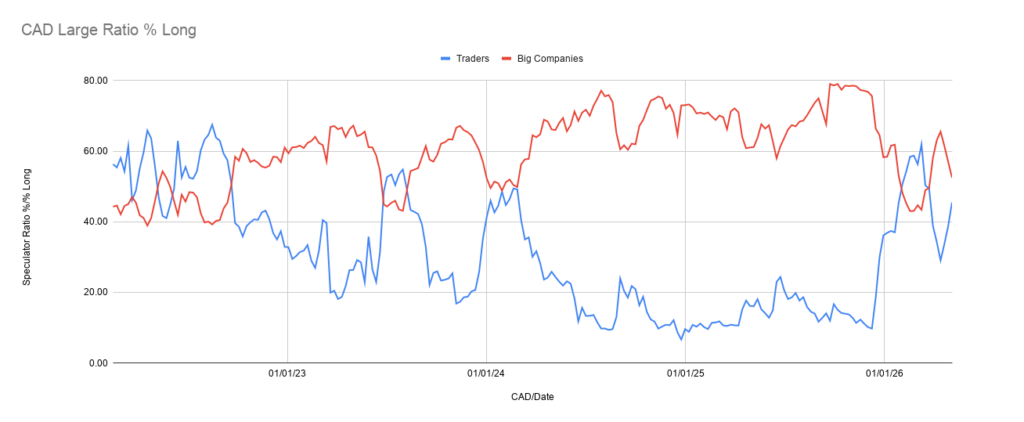
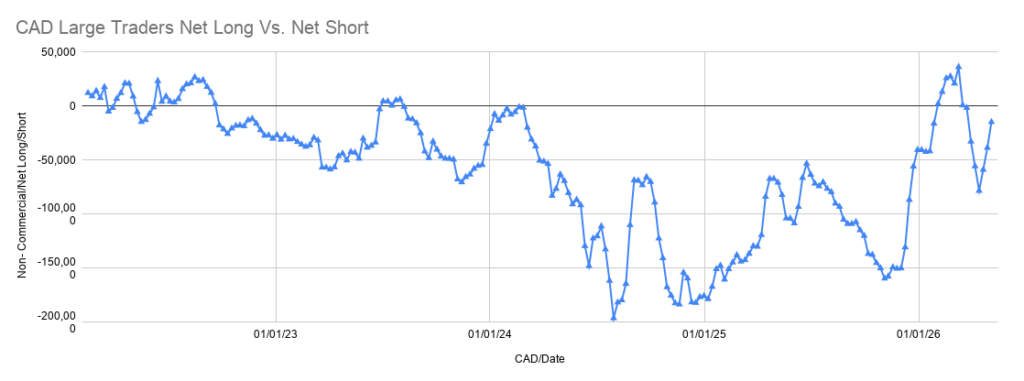
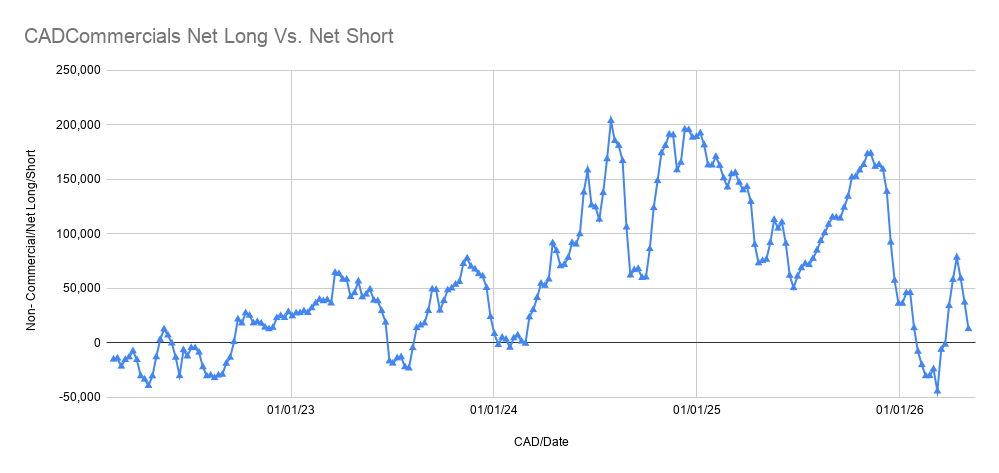
| CAD | Net short -14,659 | 45.47% | Mildly bearish, confirms May weakness |
| GBP | Net short -63,908 | 33.10% | Heavily short, room to unwind |
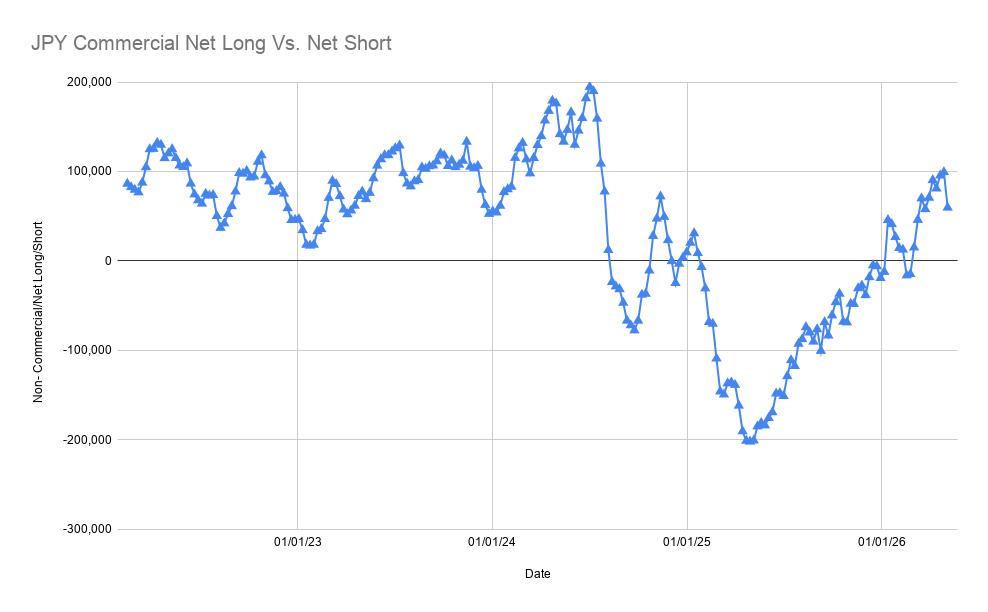
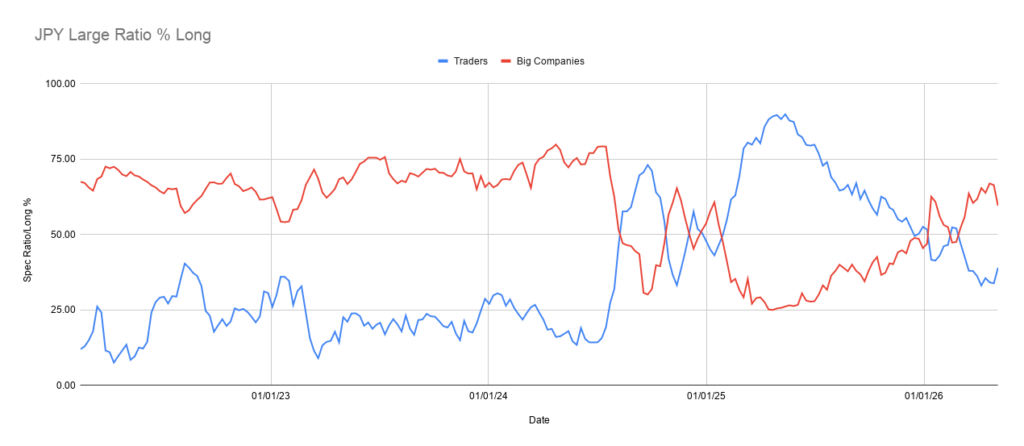
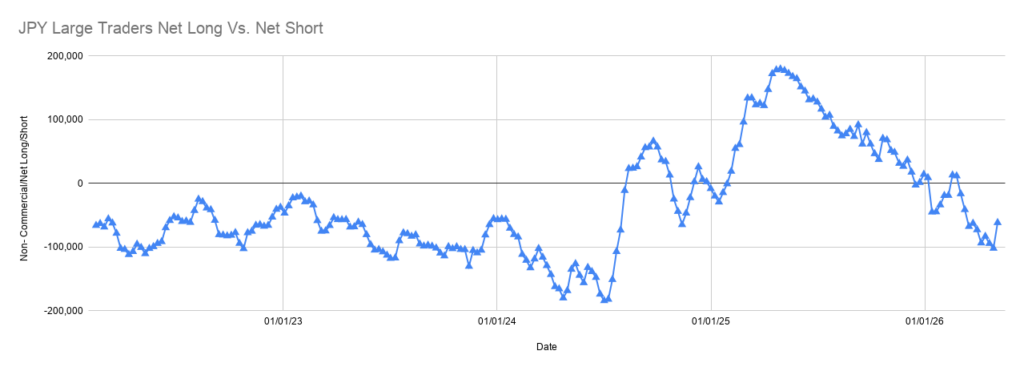
| JPY | Net short -61,738 | 38.97% | Heavily short, confirms structural weakness |
| CHF | Net short -34,521 | 14.64% | Oversold — short squeeze potential |
| NZD | Net short -48,251 | 13.65% | Oversold — short squeeze potential |
Three signals jump off this table:
1. CHF and NZD are positioned for a squeeze. Both sit in the low-teens on the long ratio — historically extreme readings. CHF is already outperforming (#1 on 3M), and NZD is already breaking out (#1 in May). When extreme positioning meets breakout price action, you generally don’t fade it — you trade alongside it until exhaustion shows up. Long CHF and long NZD vs the weakest fiats (JPY, EUR, CAD) is doubly supported.
2. AUD is the crowded trade. The 4-of-4 AUD setups all screen well, but at 68.93% long ratio the speculator pile-up is a flashing yellow light. If geopolitical risk escalates (more on Iran below), AUD is exactly the kind of position that gets liquidated first. I am not eliminating AUD trades.
3. JPY shorts are confirmed but not yet extreme. At 38.97% long ratio, the JPY short is heavy but not at crisis levels. Combined with BoJ at 0.75% and the macro backdrop of rising oil prices, JPY weakness is the one structural call I have highest confidence in — provided the BoJ doesn’t surprise.
Macro Backdrop — What Could Break Everything
The macro outlook for this week is anything but quiet:
- Active Iran-USA conflict. The Strait of Hormuz is functionally closed for the foreseeable future. Talks have stalled.
- Oil on the rise as a direct consequence. This is inflationary across the energy import chain — which means CAD, NZD, AUD beneficiaries on the commodity side, but Japan, Europe, and Switzerland on the inflationary cost side.
- Gold consolidating at high levels. Not selling off — just resting after a generational run. This is supportive of fiat winding back some lost ground (which the 3-month chart shows), but a fresh leg up in gold would re-anchor the broader thesis.
- VIX at $17.19. Not panicked, not complacent. Mid-cycle.
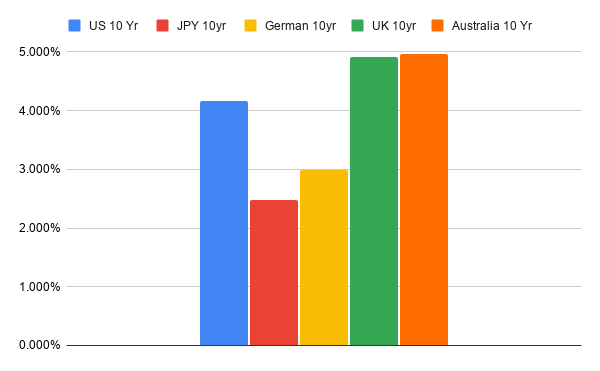
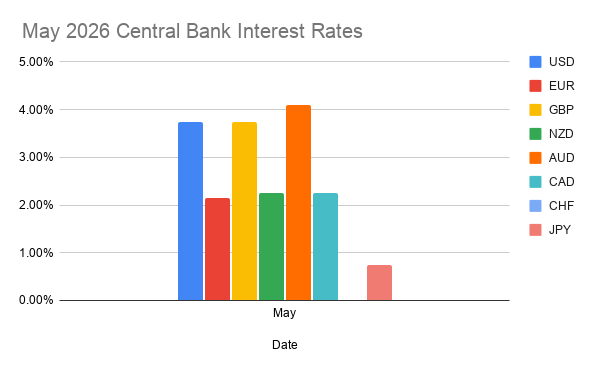
- Central bank rates anchor the carry hierarchy: AUD 4.35% > USD 3.75% = GBP 3.75% > NZD 2.25% = CAD 2.25% > EUR 2.15% > JPY 0.75% > CHF 0%.
The single biggest macro risk to the trade book above is a Japanese carry-trade unwind. Here’s the chain:
- Strait of Hormuz closure means Japan struggles to import oil.
- Energy costs spike, pushing Japanese inflation higher.
- BoJ is forced to hike rates more aggressively than markets expect.
- JPY suddenly strengthens; carry trades funded in JPY (long AUD/JPY, USD/JPY, GBP/JPY) get liquidated en masse.
- Risk-off cascade hits AUD and NZD particularly hard.
This is a low-probability, high-impact tail risk. It does not invalidate the JPY-short trades — but it does justify smaller size and wider risk parameters than the trend would otherwise suggest.
Weekly Playbook
- Primary expressions: Long AUD/JPY (carry + trend), Long CHF/JPY (safe-haven trend), Short USD/CHF (oversold CHF squeeze), Short EUR/AUD (clean trend).
- Asymmetric squeeze plays: Long NZD/JPY and Short EUR/NZD — riding the May breakout while COT shorts cover.
- Caution on AUD size: With speculators 68.93% long, treat AUD trades as smaller-than-normal positions with tight stops below recent swing lows.
- Avoid: Counter-trend JPY longs and CAD longs — both are getting hit from multiple sides.
- Event risk to monitor: Strait of Hormuz developments, any BoJ commentary on inflation, US CPI, oil price action above key resistance.
- What flips the view: A break of gold to fresh all-time highs above $4,000 (rough level — confirm with your own framework) re-establishes the “everything is weak vs gold” regime. A surprise BoJ hike would gut the carry trades. A ceasefire or de-escalation in the Strait flips oil and reverses the AUD/CAD strength gap.
Risk Management Note
Trend alignment across four timeframes is a high-quality filter, not a guarantee. The 4-of-4 setups have the best base rate, but they are the most obvious — meaning crowding risk and fast unwinds are part of the cost of admission. The 3-of-4 setups are where edge often lives, particularly when the broken timeframe is the most recent (May), because that’s where regime change first shows up.
Position sizing matters more than direction this week. With Iran-USA active, oil rising, and AUD speculator positioning crowded, a single headline can rinse a poorly-sized book. Stay small into Tier 1 events. Let the trades you have time to manage be the ones you carry over the weekend.
Final Thoughts
The gold-anchored read is consistent and it tells a clear story: fiat is losing, but at very different rates, and JPY is losing fastest. Layer in COT positioning and you get a cleaner picture of which trends still have room and which are getting crowded. Layer in the macro and you get the catalysts that will either confirm the read or break it.
This week, my book leans long AUD and CHF, short JPY across the board, and is selectively short USD vs the franc. NZD is the squeeze trade. CAD is the avoid. Trade size with respect for the geopolitical tape.
Stay sharp. See you next week.
— Takezo
Data sources: CFTC Commitment of Traders | Currency strength charts: internal | Macro & rates: weekly outlook compilation, May 9th 2026.
Disclaimer: This post reflects my own analysis and is not investment advice. FX is leveraged and can move violently against a thesis. Position sizing, stops, and personal risk tolerance are your responsibility.