
Hormuz still shut, gold still consolidating, and 14 currency pairs lined up with the same answer
By Takezo Trading | 23/05/2026 | Reading time: ~11 minutes
- Macro driver: Inflation persistence powered by a war-led oil shock, with the Strait of Hormuz still functionally closed.
- Market regime: Pro-risk but cautious. War tends to be inflationary in the long run, and rate expectations are now reflecting that thesis.
- Cross-asset signal: Gold is consolidating around the $4,500 handle after the rip-and-pause pattern that defined the last few weeks. VIX at $16.70, gold/oil ratio at 46.52.
- The clean FX read: When we lay the four gold-relative strength charts on top of each other, fourteen currency pairs print the same directional signal in every single timeframe — and the JPY-weak / CHF-strong / AUD-strong / EUR-weak axis dominates.
- The headline risk: A BoJ that gets forced into hiking by imported energy inflation. That’s the trigger for the largest carry book in the world to unwind — and carry unwinds are rarely orderly.
For background on the gold/oil reading, see: The Gold-to-Oil Ratio: A Historical and Practical Guide.
The Battlefield: What’s Actually Driving This Week
The single most important fact going into next week’s trade is that the Strait of Hormuz remains closed, and nothing in this week’s diplomatic noise suggested it’s about to reopen. Iranian Supreme Leader directives kept the country’s enriched uranium reserves locked in-country, which knocked the legs out from under whatever optimism had been building around the US proposal delivered via Pakistan. A fragile ceasefire is technically in place, but with both sides trading shots in the strait earlier this month and almost no commercial tonnage moving through the chokepoint, the market is being forced to price a regime — not a one-off event.
Brent finished the week near $108–110 after a wild ride from above $116 in early May down to $104, then back up. Oil is the lever here. As long as Hormuz is shut and roughly 20% of seaborne crude is having to find another route, the inflationary pressure stays on, and the central bank cutting cycle stays in the freezer.
That feeds directly into three FX consequences:
One — Japan is uniquely exposed. Japan imports essentially all of its energy. A closed Hormuz puts direct upward pressure on Japanese import costs, which eventually forces the BoJ’s hand. The BoJ sits at 0.75% — still the lowest policy rate in G10, and still the world’s funding currency. If imported inflation forces a meaningful hike, the yen-funded carry trade unwinds, and that’s the kind of move that doesn’t ask permission before it happens.
Two — Gold is doing the quiet thing. After tagging $5,595 at the highs and printing all-time records earlier in this cycle, gold has spent most of May consolidating between roughly $4,450 and $4,580. That’s a market that’s absorbing volatility rather than panicking. The base under price is being built. When everything else is screaming, gold sitting still is itself a signal.
Three — The dollar is caught. The USD aggregate futures position has been bleeding lower for weeks while the index itself has tried to grind higher. Asset managers are still adding modestly to net-longs, but large speculators have been net cutters. Translation: positioning is no longer the tailwind it was in March, and the dollar’s path now depends almost entirely on whether the Fed can stay on hold without breaking something.
Market Snapshot
A quick reference card — these are the readings I’m trading off this week.
Policy Rates:
| CCY | Rate |
|---|---|
| AUD | 4.35% |
| GBP | 3.75% |
| USD | 3.75% |
| NZD | 2.25% |
| CAD | 2.25% |
| EUR | 2.15% |
| JPY | 0.75% |
| CHF | 0.00% |
10-Year Yields:
| CCY | Yield |
|---|---|
| AUD | 4.923% |
| GBP | 4.910% |
| USD | 4.556% |
| EUR | 3.039% |
| JPY | 2.740% |
Equities vs Gold (lower = gold dominant):
- S&P 500 / Gold: 1.66
- DAX / Gold: 6.40
- CAC 40 / Gold: 2.09
- FTSE 100 / Gold: 3.12
- Nikkei 225 / Gold: 0.088
Volatility: VIX at $16.70 — elevated, not panicked.
Commodities: Gold/Oil at 46.52 — still in the zone consistent with expensive gold or cheap-relative-oil, despite the war premium.
The Gold-Anchored Framework
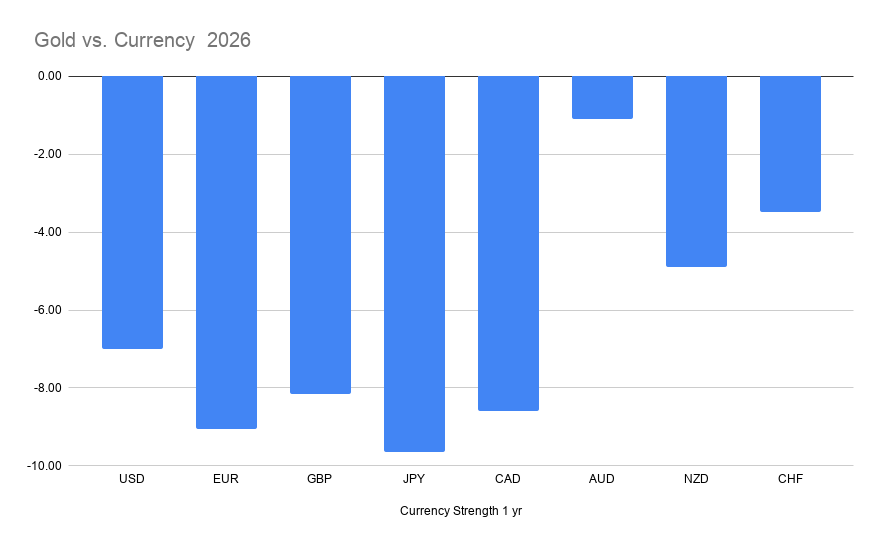
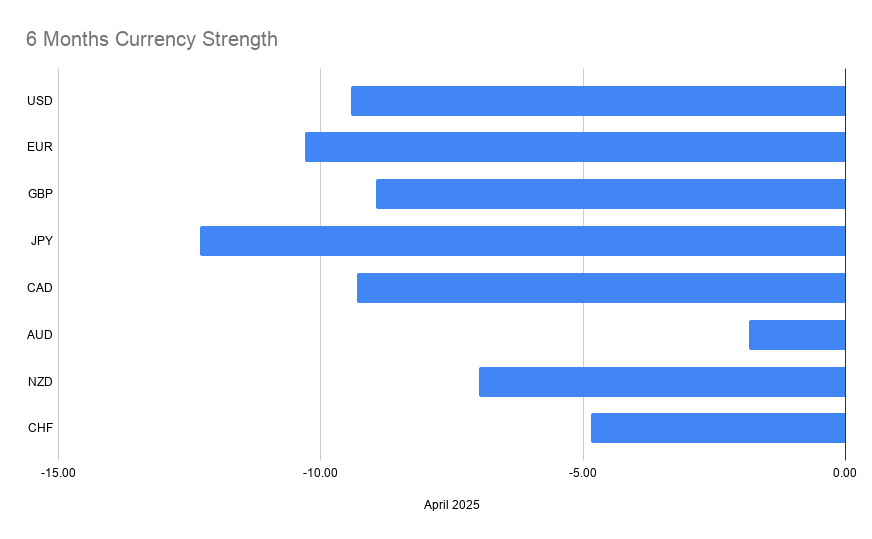
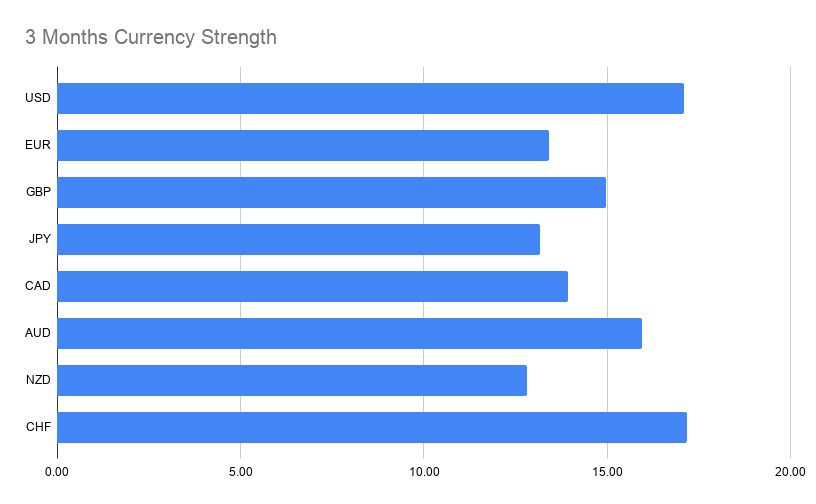
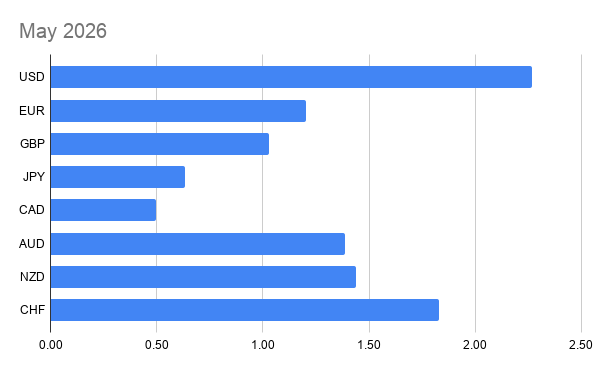
Quick refresher for new readers: gold is the only honest scoreboard for relative fiat strength because it doesn’t have a central bank, a budget deficit, or a story to sell. When I rank G8 currencies against gold across four windows — 1-year, 6-month, 3-month, and the current month — pairs that come out with the same directional signal in every window have confluence, and confluence is what separates a trade from a guess.
Here’s how the rankings stack up from the four charts.
Year-to-date (1yr vs gold): AUD ▶ CHF ▶ NZD ▶ USD ▶ GBP ▶ CAD ▶ EUR ▶ JPY
6-Month: AUD ▶ CHF ▶ NZD ▶ GBP ▶ CAD ▶ USD ▶ EUR ▶ JPY
3-Month: CHF ▶ USD ▶ AUD ▶ GBP ▶ CAD ▶ EUR ▶ JPY ▶ NZD
May 2026: USD ▶ CHF ▶ NZD ▶ AUD ▶ EUR ▶ GBP ▶ JPY ▶ CAD
The patterns jump out immediately:
- JPY is bottom-quartile in every single window. It’s the universal funding leg.
- CHF and AUD are top-quartile in every single window. Different reasons (one is the panic asset, the other is the carry asset), but the read is the same.
- EUR is bottom-half in every single window. The energy-import vulnerability story is showing up in the chart, and the ECB at 2.15% can’t compete on yield.
- CAD is the puzzle. With oil this expensive, CAD “should” be in the top half. It isn’t. The BoC at 2.25% is winning over the oil tailwind.
- USD is whippy. It rotates from bottom-third (6-month) to top of the heap (May). That’s positioning swinging, not trend.
Tier 1 Setups: All Four Charts Agree (4/4)
These are the highest-confluence trades — the same direction prints in every window. Fourteen of them this week. I’ve sorted them by macro relevance, not alphabetically.
The Yen-Short Cluster
The yen is the cleanest expression on the board. Every major beats it in every window. The risk to these trades isn’t direction — it’s the BoJ.
| Trade | Driver |
|---|---|
| LONG USD/JPY | Rate diff 3.0 pp, 10yr spread ~180bps, asset managers still net-short yen. |
| LONG EUR/JPY | Even weak EUR beats JPY. Pure rate-differential trade. |
| LONG GBP/JPY | Cleanest yield-spread story in G10 (BOE 3.75% vs BoJ 0.75%). |
| LONG AUD/JPY | Top carry trade in G10. RBA 4.35% vs BoJ 0.75% = the textbook long. |
| LONG CHF/JPY | Funding-currency duel. CHF wins in every window. Defensive long. |
The Strong-CHF Cluster
CHF is the quietest currency on the board, and the most consistent winner. Note: in standard FX convention, CHF sits low in the hierarchy, so most CHF-strong trades are shorts of the listed pair.
| Trade | Driver |
|---|---|
| SHORT EUR/CHF | EUR’s energy vulnerability vs CHF’s safe-haven flow. |
| SHORT GBP/CHF | Subtler than EUR/CHF but the same story. |
| SHORT CAD/CHF | CHF beats the oil currency despite oil at $108+. |
| SHORT NZD/CHF | NZD is the weakest commodity proxy. CHF wins it cleanly. |
The Strong-AUD Cluster
AUD is the highest-yielding major. With Hormuz disrupting energy flows and Asia having to import more crude through alternate routes, AUD’s commodity status helps too.
| Trade | Driver |
|---|---|
| SHORT EUR/AUD | Yield differential + commodity rotation. Strongest vs weakest in Europe. |
| SHORT GBP/AUD | RBA’s 60bps yield premium over BOE shows up cleanly. |
| LONG AUD/CAD | The most interesting one. Both are commodity currencies, but AUD wins in every window despite oil supporting CAD. The yield gap is doing the work (4.35% vs 2.25%). |
The Cross-Major Wins
Two pairs that don’t fit the clusters above but still print 4/4:
| Trade | Driver |
|---|---|
| SHORT EUR/USD | USD wins in every window. The EUR positioning unwind continues. |
| LONG GBP/CAD | UK rate premium + CAD’s structural underperformance. |
Tier 1 read in one line: Long the strong (CHF, AUD), short the weak (JPY, EUR, CAD), and the trades pay you to be patient.
Tier 2 Setups: Three of Four Charts Agree (3/4)
These trades have one window pushing back — usually the most recent one. Worth watching, but I’d want a second signal (price action, COT shift) before sizing up.
| Trade | The Dissenter |
|---|---|
| SHORT GBP/USD | 6-month disagrees — GBP outperformed USD over Q4 last year. |
| LONG USD/CAD | 6-month marginal (1 tick). |
| SHORT USD/CHF | May disagrees — USD has been the May leader, narrowly beating CHF. |
| SHORT EUR/GBP | May disagrees — EUR caught a bid this month. |
| SHORT EUR/CAD | May disagrees — CAD was the worst performer in May despite oil. |
| SHORT EUR/NZD | 3-month disagrees — NZD was the worst in Q1. |
| SHORT GBP/NZD | 3-month disagrees, same reason. |
| LONG CAD/JPY | May disagrees — JPY actually edged CAD this month. |
| LONG NZD/JPY | 3-month disagrees. |
| LONG NZD/CAD | 3-month disagrees. |
| LONG AUD/NZD | May disagrees — NZD edged AUD by 0.05. Watch this one. |
Tier 2 read: Many of the dissenters cluster in May, which tells you May broke the pattern in a few places. That’s either noise or a regime shift, and the COT data below helps differentiate.
The Top Five for the Week
If you only get to put on a handful of trades, these five maximize macro alignment with chart confluence:
- LONG CHF/JPY — Safe haven + carry funding hedge. CHF wins 4/4 vs JPY across all timeframes; CHF wins 4/4 vs almost everyone else too. If geopolitical noise spikes, this is the cleanest expression.
- LONG AUD/JPY — Highest-yielding major vs lowest-yielding major. The textbook carry. Risk: a BoJ surprise. Reward: clean trend on every chart.
- SHORT EUR/CHF — EUR’s structural energy vulnerability is real. CHF dominates EUR in every window. Lower-vol expression of the EUR-weak thesis.
- LONG GBP/JPY — Underrated. Rate differential is enormous, gilt yields anchor sterling, and the pair wins 4/4.
- LONG AUD/CAD — The commodity-bloc decider. AUD beats CAD in every window despite oil being expensive. The yield gap (4.35% vs 2.25%) is doing more work than oil right now.
The Latest COT Read (data as of May 19th, 2026)
Speculator positioning, viewed against the gold-anchored chart confluence, tells you whether the market is with you on these trades or ahead of you. This week, the read is mostly aligned — with two flags worth watching.
USD (aggregate): Net aggregate USD exposure has been falling for several weeks running, with futures traders cutting their net-long exposure to a seven-week low. Asset managers, however, are still adding modestly to USDX longs. Translation: the leveraged community is no longer enthusiastic about the dollar, but the slow money is. This aligns with the May chart but not with longer horizons.
JPY: Large speculators are at a 20-month net-short high on yen futures. Asset managers flipped net-short yen earlier in the quarter and have stayed there. This is exactly the positioning you’d expect given the chart read — but it’s also a crowded trade. Flag this one. If the BoJ moves, the unwind hits everything from USD/JPY to AUD/JPY simultaneously.
EUR: Net longs continue to be trimmed. Large speculators reduced euro longs by 31.5k contracts in the most recent reporting period. The market is in the process of giving up on the EUR-strong story it tried to write in Q1. Aligned with the chart read.
GBP: Net shorts have been climbing. Both large specs and asset managers added bearish bets in recent weeks. Aligned with the Tier 2 GBP/USD and EUR/GBP setups, not aligned with GBP/JPY and GBP/CAD longs — so the GBP cross story is more nuanced than the GBP outright story.
CHF: Gross shorts have been cut sharply (-37% large specs, -33% asset managers) over recent weeks. That’s the market closing out funding-currency shorts and beginning to acknowledge CHF strength. Aligned and trend is fresh — not crowded yet.
AUD: Large speculators are at near 13-year net-long highs. This is the crowded carry trade on the other side of the yen. Aligned with the chart but watch for sentiment extremes. AUD longs are no longer contrarian.
NZD: Asset managers have nudged net-shorts to a 15-week high. The market doesn’t like NZD on the futures book — which fits the 3-month chart, where NZD was actually the weakest performer.
CAD: Large speculators are on the cusp of flipping net-short CAD futures. Asset managers have trimmed longs notably. The futures market agrees with the chart’s verdict on CAD weakness despite oil — which suggests rate differential, not commodity exposure, is dominating CAD price action.
The two flags:
- JPY shorts and AUD longs are both crowded. That doesn’t mean exit — it means size matters. A BoJ surprise unwinds both sides simultaneously.
- CHF positioning is the freshest move on the board. That’s where the asymmetric reward-to-risk lives this week.
For deeper COT breakdowns, see the CFTC Commitments of Traders reports.
— Takezo
Data sources: Currency strength vs. gold charts produced internally; CFTC Commitments of Traders; Brent crude pricing via Fortune commodity feed; XAU/USD via spot market data.
Disclaimer: This content is for educational and informational purposes only and does not constitute financial or investment advice. Trade at your own risk.