

War, oil, and a stretched positioning book — where the cleanest FX setups are forming
By Takezo Trading | 16/05/26 | Reading time: ~12 minutes
This Week’s Bottom Line
- Macro driver: Inflation persistence driven by a war-led oil shock, with the Strait of Hormuz functionally closed.
- Market regime: Pro-risk but cautious. War is inflationary over time, and that thesis is now showing in oil prices, rates expectations, and the gold complex.
- Cross-asset signal: Gold has been consolidating for several weeks, VIX sits at $18.43, and the gold/oil ratio is at 44.89 — a reading consistent with elevated gold, depressed oil, or both.
- FX setup: A consistent JPY-weak axis appears in every timeframe I track against gold. AUD and CHF lead on the strong side, but positioning warns one of those leaders is more dangerous than it looks.
- Key risk: A BoJ forced into hiking by imported energy inflation. That’s the unwind trigger for the largest carry book in the world.
For background on the gold/oil reading, see my deeper piece: The Gold-to-Oil Ratio: A Historical and Practical Guide.
Pro-risk drivers:
- The Japanese carry trade is still functioning — AUD at 4.35% policy, CHF at 0% — and that anchor continues to feed risk-on flows.
- War-driven oil rally lifting commodity-currency proxies.
- Gold consolidating rather than selling — markets aren’t panicked.
Anti-risk drivers:
- VIX at $18.43 — not extreme, but elevated relative to the prior regime.
- Active Iran–USA conflict with no diplomatic off-ramp visible.
- Strait of Hormuz closure threatens energy supply chains, with Japan most acutely exposed.
- If the BoJ is forced into hiking by imported inflation, the global yen-funded carry book unwinds — and carry unwinds are rarely orderly.
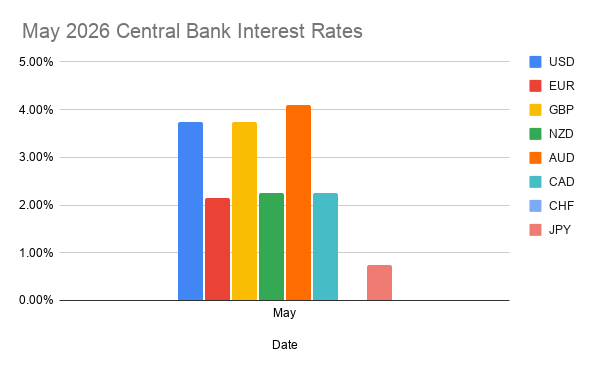
Central Bank Policy Rates
| Currency | Policy Rate |
|---|---|
| AUD | 4.35% |
| USD | 3.75% |
| GBP | 3.75% |
| NZD | 2.25% |
| CAD | 2.25% |
| EUR | 2.15% |
| JPY | 0.75% |
| CHF | 0.00% |
The carry hierarchy is intact and wide. AUD over JPY is a 360 bp differential. AUD over CHF is 435 bp. As long as that gap exists and risk sentiment holds, carry-receiving currencies have a structural tailwind.
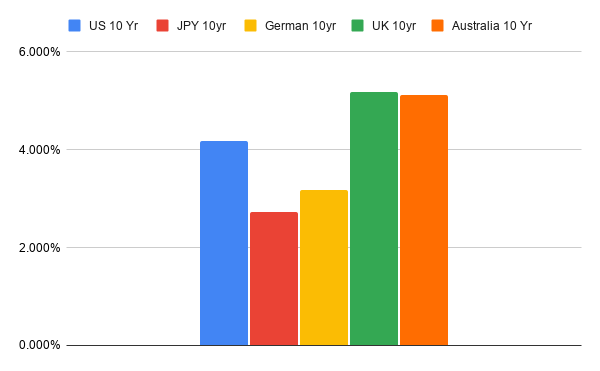
10-Year Sovereign Yields
| Country | 10Y Yield |
|---|---|
| GBP | 5.178% |
| AUD | 5.118% |
| USD | 4.597% |
| EUR | 3.184% |
| JPY | 2.718% |
The British and Australian long ends are pricing the most inflation persistence. The U.S. 10Y is meaningfully below both. The Japanese 10Y at 2.718% is the chart to watch — every basis point higher tightens the case for BoJ action.
Equities vs Gold
| Index | Ratio vs Gold |
|---|---|
| DAX | 6.13 |
| FTSE 100 | 2.99 |
| CAC 40 | 2.04 |
| S&P 500 | 1.63 |
| Nikkei 225 | 0.085 |
European equities — particularly the DAX — are outperforming gold by a wide margin. U.S. equities are barely above parity. The Nikkei is dramatically underperforming gold on this ratio basis, which fits the JPY weakness story we’ll come back to in the COT and trade sections.
Volatility & Commodities
- VIX: $18.43
- Gold/Oil Ratio: 44.89
Currency Strength vs Gold — Four Timeframes
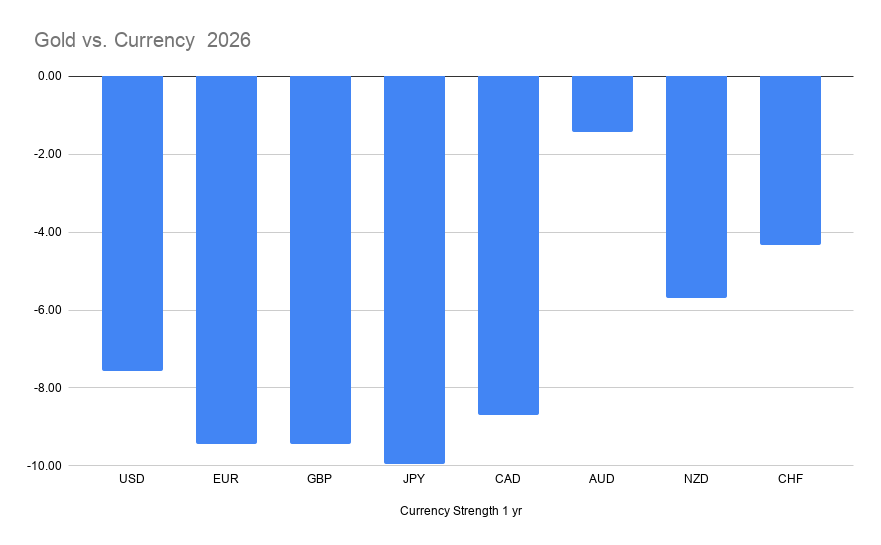
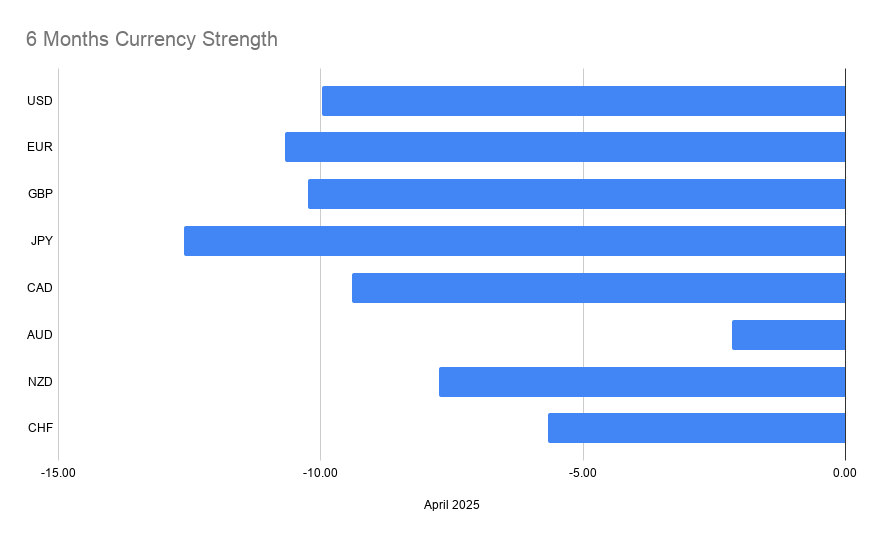
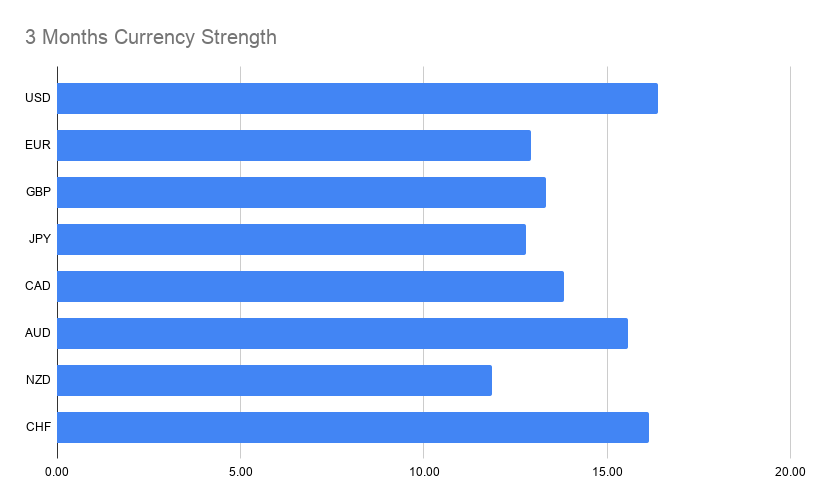
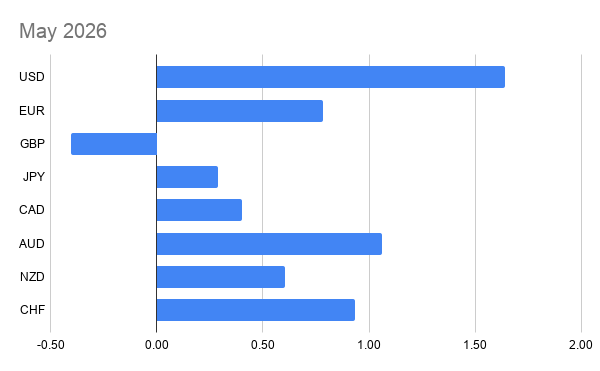
Gold has been the reference asset of 2026, so I use it as a neutral benchmark to rank fiat strength. The cleanest signals come from currencies that line up consistently across multiple timeframes.
Rankings vs Gold (strongest → weakest):
| Currency | 1 Year | 6 Months | 3 Months | May MTD |
|---|---|---|---|---|
| USD | −7.5 | −10.0 | +16.4 | +1.65 |
| EUR | −9.5 | −10.5 | +12.8 | +0.78 |
| GBP | −9.5 | −10.0 | +13.3 | −0.40 |
| JPY | −10.0 | −12.5 | +12.7 | +0.28 |
| CAD | −8.7 | −9.5 | +13.8 | +0.40 |
| AUD | −1.4 | −2.0 | +15.5 | +1.05 |
| NZD | −5.7 | −7.5 | +11.8 | +0.60 |
| CHF | −4.3 | −5.5 | +16.1 | +0.93 |
The takeaways:
- AUD and CHF are the consistent leaders across the long timeframes (Y to date, 6M). Both held up best when gold was running.
- JPY is the consistent laggard across every window. Most negative on the 1Y and 6M, and still mid-pack at best on the recent prints.
- EUR and GBP are the secondary laggards — consistently weak on the longer windows.
- The 3-month window flipping positive across the board tells you gold pulled back recently. That’s where regime-change signals first emerge, but it doesn’t override the longer-trend picture.
COT Positioning — May 16th
Sorted by % long ratio, the gap between most-loved and most-hated is wide:
| Currency | Net Spec Position | % Long Ratio | Commercial Position |
|---|---|---|---|
| AUD | +84,990 | 69.62% | -111,803 |
| EUR | +40,200 | 54.93% | -79,054 |
| CAD | -16,242 | 45.23% | +13,717 |
| GBP | -43,059 | 39.36% | +44,651 |
| JPY | -75,102 | 36.37% | +74,143 |
| NZD | -39,150 | 18.85% | +41,517 |
| CHF | -36,197 | 11.82% | +44,280 |
The two extremes carry the message this week:
- CHF at 11.82% long is the most washed-out short. Speculators have essentially capitulated. Commercials are net long 44,280 contracts. By positioning alone, this is the most contrarian setup in the report.
- NZD at 18.85% sits alongside CHF in oversold territory.
For the full COT breakdown, see: Commitment of Traders Update — May 16th, 2026.
Trade Watchlist — Tier 1 & Tier 2
The strongest setups are where currency strength vs gold, the carry framework, and COT positioning point the same direction. Pairs are tiered by how many of the four gold-relative timeframes (1Y, 6M, 3M, May MTD) agree.
Tier 1 — Highest Conviction (aligned in ALL 4 timeframes)
Fifteen pairs show the same relative-strength signal across every window I track. These are the cleanest expressions in the book this week.
| Pair | Direction | Rationale |
|---|---|---|
| USD/JPY | Long | Long USD, short JPY — JPY weakest vs gold across all windows |
| EUR/JPY | Long | Long EUR, short JPY |
| CAD/JPY | Long | Long CAD, short JPY |
| AUD/JPY | Long | Long AUD, short JPY (see AUD caveat below) |
| CHF/JPY | Long | Long CHF, short JPY — carry-light but momentum-rich |
| EUR/USD | Short | Long USD, short EUR |
| EUR/AUD | Short | Long AUD, short EUR |
| EUR/CHF | Short | Long CHF, short EUR — strongest contrarian setup of the week |
| GBP/CAD | Short | Long CAD, short GBP |
| GBP/AUD | Short | Long AUD, short GBP |
| GBP/CHF | Short | Long CHF, short GBP |
| AUD/CAD | Long | Long AUD, short CAD |
| CAD/CHF | Short | Long CHF, short CAD |
| AUD/NZD | Long | Long AUD, short NZD |
| NZD/CHF | Short | Long CHF, short NZD |
The structural read: AUD and CHF dominate the long side across every window. JPY dominates the short side. EUR and GBP fill the secondary short bench. Every Tier 1 pair is an expression of one of those four themes.
Tier 2 — Medium Conviction (aligned in 3 of 4 timeframes)
Eight pairs show alignment across most windows with one timeframe of disagreement. These are the watchlist — secondary entries, smaller size, or “wait for confirmation” trades.
| Pair | Direction | Disagreeing Timeframe | Note |
|---|---|---|---|
| USD/CAD | Long | 6-Month (CAD slightly stronger) | USD leads in 3 of 4 windows |
| GBP/USD | Short | 6-Month (essentially tied) | USD edges GBP across most windows |
| EUR/CAD | Short | May (EUR edged CAD) | Long CAD vs EUR on the longer view |
| GBP/JPY | Long | May (GBP the only negative print) | Strong on 1Y/6M/3M; soft in May |
| GBP/NZD | Short | 3-Month (GBP outperformed NZD) | Long NZD vs GBP outside the 3M window |
| NZD/JPY | Long | 3-Month (JPY outperformed NZD) | NZD is the rotation candidate |
| NZD/CAD | Long | 3-Month (CAD outperformed NZD) | NZD strength returning in May |
| AUD/CHF | Long | 3-Month (CHF edged AUD) | Carry and momentum favor it, but both legs are at positioning extremes — crowded long vs washed-out short on COT |
Central Bank Scoreboard
Fed (USD, 3.75%): Holding the line. With oil rising and the 10Y at 4.597%, the cutting narrative is on pause. The next meeting will be data-dependent on whether energy passes through to core inflation prints.
BoE (GBP, 3.75%): The 5.178% 10Y is the highest in the G10 majors — the market is pricing real inflation risk in the UK. The Bank is in an uncomfortable spot.
RBA (AUD, 4.35%): Highest policy rate in the G10. The Aussie carry advantage is intact, but the currency itself is crowded long — a hawkish central bank doesn’t help when positioning is already maxed.
RBNZ (NZD, 2.25%): Lower-yielder, but specs are oversold to 18.85%. Any policy surprise to the upside has outsized squeeze potential.
BoC (CAD, 2.25%): Quiet. CAD positioning is the most neutral in the report — the cleanest “no trade” of the week.
ECB (EUR, 2.15%): EUR is one of the weakest currencies vs gold over the longer windows. Specs are still net long (54.93%), which leaves room for further downside if the positioning rolls.
SNB (CHF, 0.00%): Zero rate, yet CHF is among the strongest vs gold. Safe-haven flows and stretched short positioning are the story. The SNB itself isn’t the catalyst — sentiment is.
BoJ (JPY, 0.75%): The single most important central bank in the world right now. Imported energy inflation via Hormuz closure puts the BoJ under direct pressure. Every basis point on the JGB 10Y matters. If the BoJ surprises hawkish, every JPY-funded position in the world repositions in days.
Event Risk & Watch List
Tier 1 — what can change the regime:
- Any BoJ communication or surprise policy move — by far the highest-impact event possible this week. Watch for verbal intervention, JGB yield ceiling adjustments, or any signal that energy import costs are forcing a policy rethink.
- Strait of Hormuz developments — any escalation pushes oil higher; any de-escalation flips the entire inflation/carry narrative.
- U.S. inflation prints — energy passthrough is the variable that locks the Fed in place vs allows resumption of cuts.
- Gold price action — if the consolidation breaks higher, the fiat-debasement story gets fuel. If it breaks lower, the recent 3-month rotation in fiat performance gains weight.
Disclaimer: This newsletter is for educational and informational purposes only and does not constitute financial advice. All trading involves substantial risk of loss. Do your own research and consult a licensed professional before making any trading decisions.