Week of 11 July 2026 — Gold-Benchmarked Pair Analysis
The Method
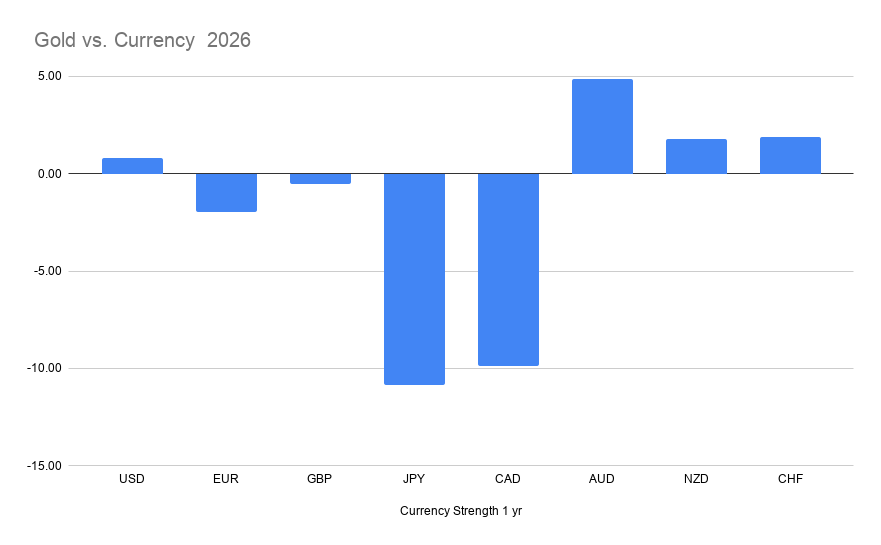
Gold is the yardstick. By measuring each of the eight majors against gold over the same window, we get a common scale — and once every currency is priced in the same unit, gold drops out of the comparison entirely and we’re left with pure relative strength between the currencies themselves.
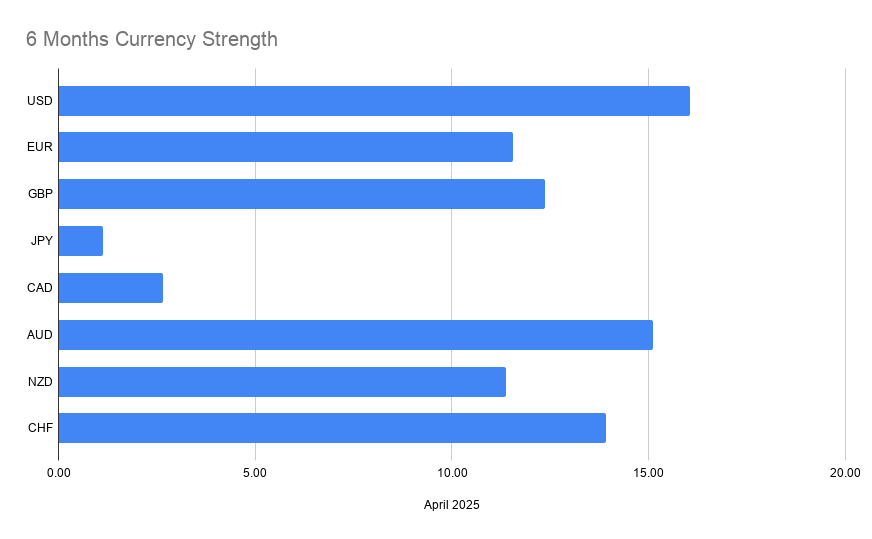
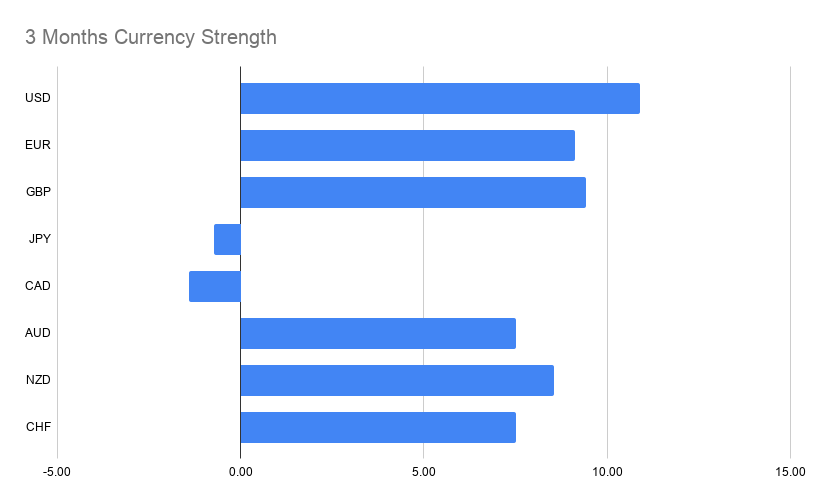
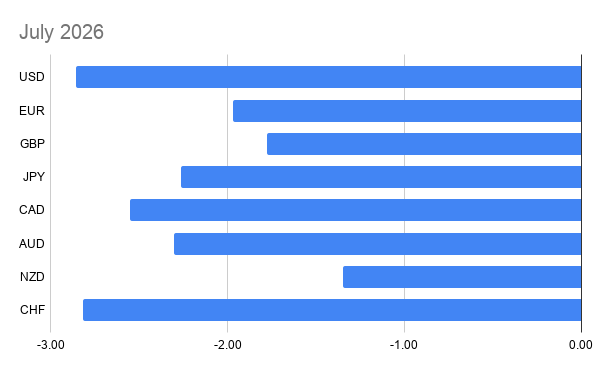
We run that comparison across four timeframes: the 1-Year, the 6-Month, the 3-Month, and the current month. A pair earns a place below only when the same currency is stronger across multiple windows. Where a pair points one way on the long charts and the other way on the short ones, it has no edge and it gets left out.
This Week’s Picture
Two currencies are doing the heavy lifting on the weak side. The Canadian dollar and the yen sit at or near the bottom of the 3-month, 6-month and 1-year charts, and neither recovers enough ground in July to change the story. That consistency is what produces most of this week’s high-conviction signals.
The complication is the US dollar. It is the strongest currency on both the 3-month and 6-month charts — and the weakest on the July chart, propping up the bottom of the table alongside the Swiss franc. That single reversal is responsible for almost every setup that fell short of full confirmation. It’s the tension worth watching this week: either July was noise and the dollar reasserts, or the medium-term dollar trend is starting to turn over.
High-Conviction Signals
These pairs point the same direction on all four charts. The long-vs-CAD and long-vs-JPY trades dominate for the reason described above, and EUR/GBP is the one clean cross on the list — sterling has held above the euro in every window.
- EUR/CAD — Long
- GBP/CAD — Long
- AUD/CAD — Long
- NZD/CAD — Long
- EUR/JPY — Long
- GBP/JPY — Long
- NZD/JPY — Long
- EUR/GBP — Short
The Watchlist
These pairs align on three of the four charts. They are not wrong — they are simply unconfirmed, and the chart they fail on is named beside each one. Nearly all of them fail on July, and nearly all of them involve the dollar. Lower conviction, and worth sizing accordingly.
- USD/CAD — Long (unconfirmed on July)
- USD/JPY — Long (unconfirmed on July)
- CHF/JPY — Long (unconfirmed on July)
- EUR/USD — Short (unconfirmed on July)
- GBP/USD — Short (unconfirmed on July)
- CAD/CHF — Short (unconfirmed on July)
- AUD/JPY — Long (too close to call on July)
- AUD/CHF — Long (too close to call on 3-Month)
The last two deserve a footnote. AUD/JPY on July and AUD/CHF on the 3-month are dead heats — the bars are effectively level rather than pointing the other way. That is a meaningfully better position than an outright reversal, and I’d rank those two above the rest of the watchlist.
What Didn’t Make the Cut
Twelve of the twenty-eight pairs split evenly across the timeframes and were excluded: EUR/AUD, EUR/NZD, EUR/CHF, GBP/AUD, GBP/NZD, GBP/CHF, AUD/NZD, AUD/USD, NZD/USD, NZD/CHF, USD/CHF and CAD/JPY.
That is a larger discard pile than usual, and it is worth saying so plainly. When the dollar reverses this sharply between the monthly and the medium-term charts, it cuts a lot of pairs straight down the middle. A quiet week for signals is information in itself — the cleanest edge available right now is against the loonie and the yen, and very little else is offering a clear read.
See you next week.