

Four-timeframe comparative analysis: 1 year, 6 months, 3 months and May 2026
A quick note to my regular readers — I’m currently stretched across several other business commitments and i’m not able to maintain my full posting schedule at the moment. I appreciate your patience. I’ll be back to regular, in-depth posts as soon as my schedule opens up. In the meantime, I’ll continue publishing the weekly currency strength analysis each week without fail — it’s the one thing I won’t let slide.
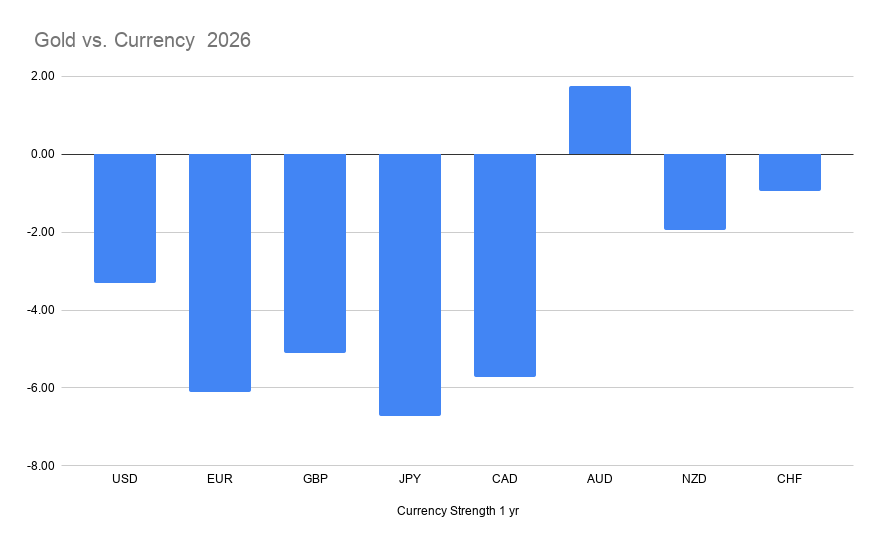
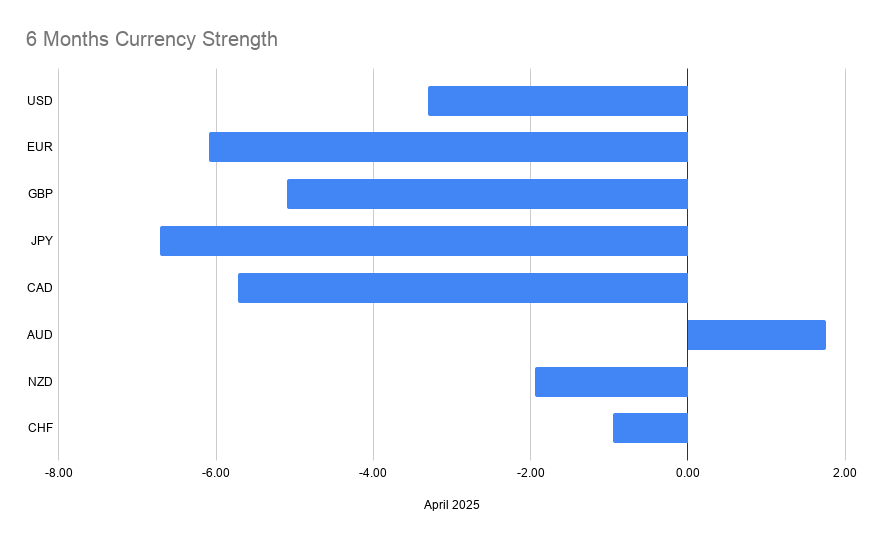
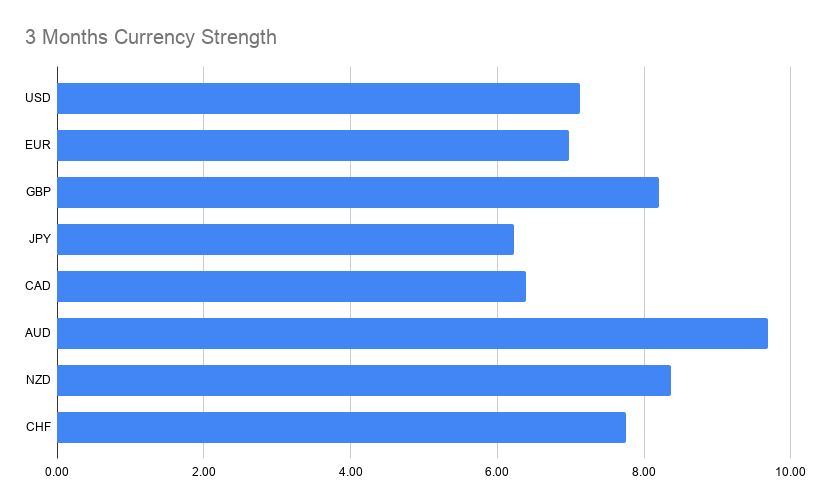
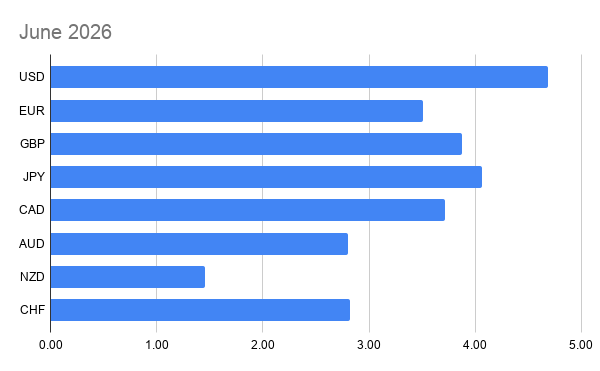
This week’s analysis uses gold as our neutral benchmark to compare the relative strength of the eight major currencies. By measuring each currency against gold — rather than against each other directly — we remove the bias that comes from any single pair and get a cleaner view of who is actually gaining and who is losing purchasing power across time.
Four timeframes were assessed: 1 year (2026 to date), 6 months , 3 months, and May 2026. Trade recommendations are drawn purely from where currencies rank in these charts — no fundamentals, no technicals, no economic data. Strength is strength.
Tier 1 — Confirmed in All 4 Timeframes
These are the highest-conviction setups this week. The directional signal is consistent across every single timeframe measured.
| Pair | Bias | Note |
|---|---|---|
| AUD/JPY | Long | AUD 1st across 3 timeframes; JPY last across 3 timeframes. Largest divergence on the board. |
| EUR/AUD | Short | AUD dominant on longer timeframes; EUR bottom half consistently. |
| AUD/CAD | Long | CAD ranked 7th over 1yr, 6m and 3m. AUD top-ranked over same periods. |
| NZD/JPY | Long | NZD 2nd strongest across 1yr, 6m and 3m. JPY last across same periods. |
| EUR/NZD | Short | NZD outranks EUR across all four timeframes. EUR shows no recovery on any window. |
| NZD/CAD | Long | NZD top 2 vs CAD bottom 2 across the three longer timeframes. June confirms the gap persists. |
Tier 2 — Confirmed in 3 of 4 Timeframes
Solid setups, but note the diverging timeframe before pulling the trigger. The one timeframe where the signal breaks is flagged.
| Pair | Bias | Diverging Timeframe | Note |
|---|---|---|---|
| CHF/JPY | Long | June 2026 | CHF 3rd–4th across 1yr, 6m, 3m; JPY last. Both rotate sharply in June. |
| EUR/CHF | Short | June 2026 | CHF outranks EUR on all longer-term windows. June sees both currencies weaken. |
| CAD/CHF | Short | June 2026 | CHF upper half; CAD lower half across three longer periods. |
| AUD/USD | Long | June 2026 | AUD leads USD on 1yr, 6m and 3m. USD flips to 1st in June — watch this closely. |
| NZD/USD | Long | June 2026 | Same dynamic as AUD/USD. USD’s June surge is worth monitoring for confirmation of a shift. |
| GBP/JPY | Long | 1 Year | GBP rises to 3rd in 3m and June; JPY weak across 1yr and 6m. |
| GBP/EUR | Long | 1 Year | GBP gaining strength on shorter timeframes while EUR remains a persistent underperformer. |
| GBP/CAD | Long | 1 Year | GBP’s recent strength on 3m and June contrasts with CAD’s consistent weakness. |
This analysis is based purely on relative currency strength using gold as a neutral benchmark. No other data sources, fundamentals, or economic data have been used Past strength trends do not guarantee future direction. Always apply your own risk management.
— Takezo Trading | takezotrading.com